WiFiScanner for Windows: Complete User Guide
What This Guide Covers
This is the exhaustive reference: every tab, sub-tab, button, checkbox, and dialog in the app, in plain language: what it does and why you'd use it while diagnosing or improving a WiFi network.
Before You Upgrade
Installing a new version updates the app itself (in Program Files) and leaves your data alone - BSSID Notes, scan history, saved settings, integration credentials, and everything else live in a separate location the installer never touches. That said, a copy costs nothing and takes ten seconds:
%ProgramData%\AccessAgility\WiFi Scanner\core-data.dbstores everything: BSSID Notes, scan history, saved settings, SSH Devices, and Integration credentials.
Running a Scan
- Pick a source from the Scan Interface dropdown in the top-right of the window: a real WiFi adapter on this machine, a saved Remote WiFi Scanner device (SSH), or one of the always-available Remote Streamer options for receiving data pushed or streamed from another machine.
- Click the toggle switch in the top-left of the Scanner tab to start. The switch turns into a pause/stop control while scanning; results populate the grid as networks are discovered.
- Use the search box above the grid to jump straight to a specific network as you type.
If you already have results you don't want to lose, starting a new scan (or closing the app) shows a "Would you like to save scanning results?" prompt first. See Prompts You'll See.
Results Grid & Columns
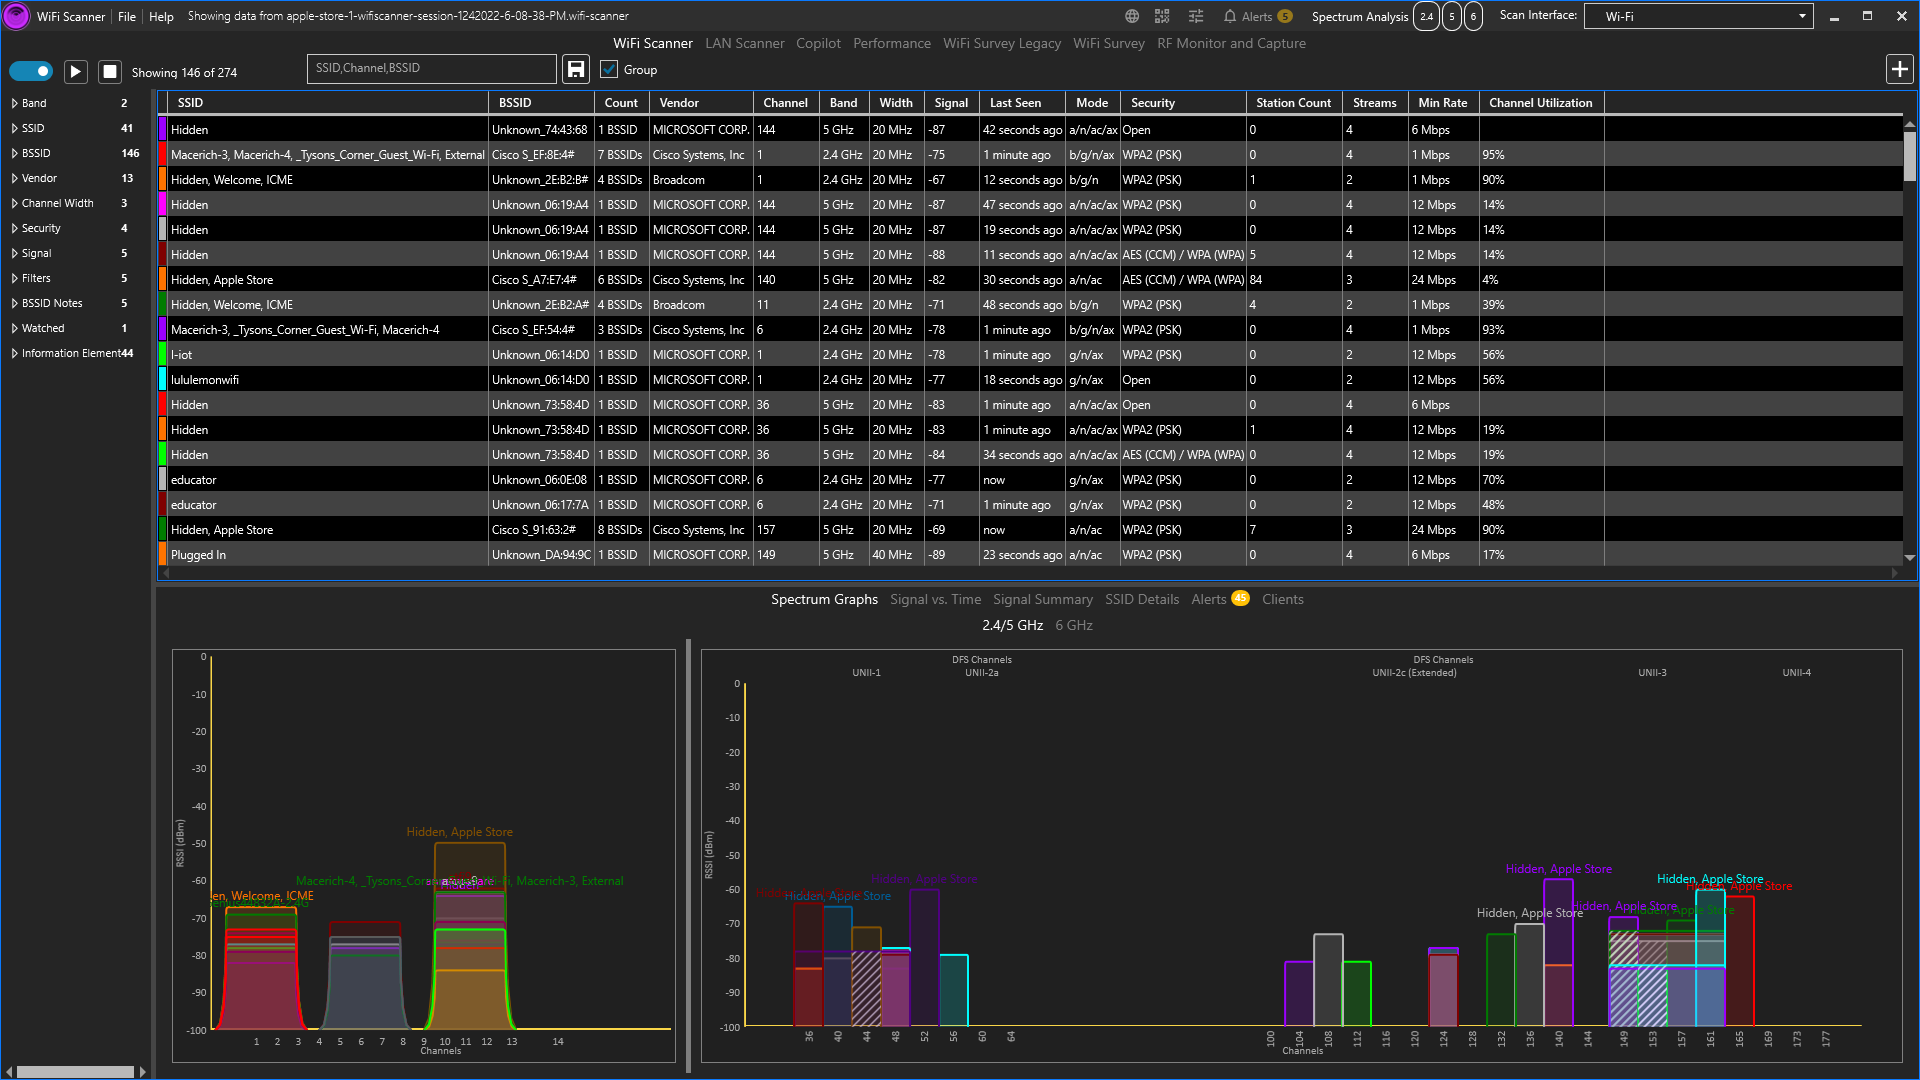
Every discovered network gets a row. The grid ships with 42 possible columns, most hidden by default. Right-click any column header to check/uncheck which ones show (the same list is also editable from Settings → Columns). Column order and width persist once you drag them, and they stay put: showing a column you had hidden puts it back exactly where it was, and a column added by an update appears on the far right rather than shifting the others along.
| Column | What it tells you |
|---|---|
| Signal | RSSI in dBm. The connected network's row is highlighted yellow; selected row is blue. |
| Channel / Band / Width | Where the AP sits in spectrum, the starting point for spotting channel overlap or overly-wide channels crowding a busy band. |
| Channel Utilization | % of airtime busy on that channel: the real congestion number, more useful than just counting neighboring APs. |
| WiFi Generation / WiFi 7 (MLO) | Detected 802.11 amendment, including Wi-Fi 7 Multi-Link Operation shown separately. |
| Security | Open, WPA2/WPA3-Personal/Enterprise, OWE. Hover for detail, including a link between an open network and its paired OWE twin when both are broadcast. |
| MFP / WPS | Management Frame Protection and WiFi Protected Setup status, both relevant security posture checks. |
| Actual Link Speed | Real OS-reported speed for the network you're connected to, not an estimate from the beacon's advertised MCS rate. |
| MCS / TPC / Streams | PHY-layer link quality indicators: modulation/coding index, transmit power control, spatial stream count. |
| Station Count | How many clients are currently associated. A busy AP with many clients on a narrow channel is a classic slowdown cause. |
| AP Uptime / Last Seen | How long an AP has apparently been up, and how recently it was observed, which helps spot flaky or "ghost" APs. |
| Vendor | Resolved from the BSSID's MAC OUI. A randomized or locally administered BSSID has no registered OUI, so its vendor comes from the beacon instead: the WPS-advertised manufacturer if there is one, otherwise the AP maker's own vendor-specific element (for example Cisco Meraki). Elements that name a standard or a chip rather than the AP maker - WMM and WPA under Microsoft's OUI, Broadcom, Qualcomm and similar - are skipped, so they are never shown as the vendor. |
| BSSID Note / Classification | Your own annotation and Own/Neighboring/Rogue/Interfering tag, set via right-click or Settings → BSSID Notes. |
| Speed Test columns (8 of them) | Recent/Min/Max/Avg Download and Upload, populated once you've run a speed test while connected to that network. |
Right-click a row
- Copy / Copy All Columns and Fields / Copy All Columns and Header Names: grab a row's data for pasting into a report or ticket.
- Edit BSSID Note: annotate that specific AP without leaving the grid.
APs broadcasting more than one radio (e.g. a tri-band router's 2.4/5/6GHz BSSIDs, which typically
differ only in the last digit of the MAC address) group under a plain-text header,
Vendor · 3 radios · AA:BB:CC:DD:EE:F0*, instead of appearing as unrelated
rows. Every radio still shows as its own row underneath; single-radio APs (most of them) are
unaffected.
Selecting a row drives everything in the bottom tabs: the graphs, IE detail, and Copilot findings all follow whichever AP you have selected.
Left Filter Tree
Thirteen collapsible nodes let you drill into the current scan from different angles. Click a row to filter the grid by that row alone; Ctrl-click to add or remove more rows. Rows under the same node widen the filter (two SSIDs means either), rows under different nodes narrow it (an SSID and a band means both). Press Space to switch the row you most recently added between is and is NOT, and click All Networks at the top of the tree to clear everything; clicking a node's heading only opens or closes it. The arrow keys move through the tree and the grid follows, just as clicking does. Whatever you pick is written into the search box, so you can always see the filter being applied:
The filter applies to the panes below the grid too: Spectrum Graphs, Signal vs. Time, Signal Summary and Alerts show only the networks it keeps. With Group by AP on, the graphs draw one line per AP, as the grid shows one row. The setting that keeps your connected network visible while filtering applies to the grid only. Alerts that are not about one network always show.
| Node | What it filters by |
|---|---|
| Band | 2.4/5/6 GHz; also auto-switches the matching Spectrum Graphs sub-tab. |
| SSID / BSSID / Vendor | Network name, specific radio, or hardware manufacturer. |
| Signal | One of 5 signal-strength buckets, Very High to Very Low. Sits under BSSID, where you reach for it first. |
| Channel | The channel a radio is on, the first thing to check when two APs collide. Rows read in numeric order. |
| Mode | The newest 802.11 mode the AP advertises, as the Mode column shows it: 802.11ax, 802.11be and so on. |
| Channel Width / Security | Channel width, or encryption type. |
| Alerts | One-click filters for common RF-design problems: 2.4GHz Overlapping Channels (anything not on 1/6/11), 2.4GHz/5GHz Wide Channels, 5GHz Very Wide Channels, and Hidden SSIDs. |
| Filters | Your own saved custom filters (see below). The four built-in Alerts filters listed above are regular Custom Filters too, so you can edit, rename, or remove any of them like any filter you've saved yourself. |
| BSSID Notes | Every AP in the current scan broken down by classification (Unclassified, Own, Neighboring, Rogue, Interfering), with a live count next to each. Click one to filter the grid down to just that classification. |
| Watched | How many APs currently have an active watch set up. Click it to filter the grid down to just watched APs. |
| Information Element | Built from the scan itself: one row per 802.11 element any AP is
broadcasting (HT Capabilities, RSN, Country, each vendor's own element, and so on), with a count. Click an element to
filter to the APs that carry it. To filter on one of an element's decoded values, type it into the
search box (dot11.ht_cap.ch_width == "20 MHz only") or right-click the field in
SSID Details and apply it from there. |
The toggle switch on the far left of the top toolbar shows/hides this whole panel to reclaim grid width.
Search Box & Saved Filters
The search box above the grid (watermark SSID, Channel, BSSID) does a live, comma-separated
text filter as you type. Once you've built a filter you like, click the Save Filter
(floppy disk) icon next to it. It opens a small dialog to name and save it, which then shows up under
the tree's Filters node for one-click reuse later.
A band can be written as a number: band == 5, band == 5ghz and band == "5 GHz" all mean the same band, and band ~~ 5 does too. The same spellings work on Mac, so a filter written on one platform reads the same on the other. Clicking a Band row in the tree still writes the app's own 5ghz token.
The search box also understands two more token types: type a
classification name (Own, Rogue,
Unclassified, Neighboring, or Interfering) to filter to just
that classification, or type Watched to filter to just APs with an active watch. Both
combine with the rest of your comma-separated filter text like any other token.
The "+" icon next to it is not a column-adder; it's Add Remote Scanner, a shortcut straight to Settings → Remote WiFi Scanner.
Spectrum Graphs / Signal vs. Time / Signal Summary / SSID Details / Alerts
Six tabs below the grid, all following whichever AP is selected above.
Spectrum Graphs
Per-band trapezoid charts (2.4 GHz, 5 GHz side-by-side, and 6 GHz) plotting every AP's RSSI against its channel: the primary tool for visualizing channel overlap and congestion. A multi-radio AP's SSID label gets a small muted-color tag prefix, consistent across all three band charts, so you can visually match that device's radios even though they usually land on separate band charts. If a supported USB spectrum analyzer is connected, real RF spectrum data overlays the same graphs (Live/Average/Maximum/ Utilization trace, Waterfall, Density) via the Spectrum Analysis title-bar menu. This reveals non-WiFi interference (microwave ovens, Bluetooth, cordless phones) that a WiFi-only scan can never see. Beta: currently supported for a limited number of adapters only. See Settings → Spectrum.
Signal vs. Time
A rolling line chart of every visible AP's RSSI over the last ~13 scan ticks. Watch for instability or fading that a single snapshot would miss, useful for diagnosing intermittent connectivity. Click a network in the grid above to highlight its line and dim the rest, since dozens of unlabeled lines are hard to read at once. Plotted lines are capped at the strongest N by signal (see Settings → General → Max networks shown) so the graph stays responsive with a busy scan. Your connected network is always shown regardless of the cap, and always renders in the same gold used for its row in the results grid.
Signal Summary
Three side-by-side charts (Signal Rank, Adjacent Channel Interference, Co-Channel Interference), each with its own RSSI-threshold slider and Any/Same Band/SSID/Width toggle. This is the tool for manual channel-planning decisions: "how many APs are realistically competing with mine at a signal level that matters?"
SSID Details
The 802.11 Information Elements of the selected AP's beacon, decoded into an expandable tree, for when you need to see exactly what the AP is actually broadcasting, not just the app's interpretation of it. The Details column says what each element means on its collapsed row (“6(B), 9, 12(B) … Mbit/sec”, “Local Power Constraint: 3 dB”) rather than its bytes; expanding a row goes down to the individual bits: HT and VHT capabilities, HE and EHT (Wi-Fi 6/7) capabilities and operation, Transmit Power Envelope, RSN and RSNXE, WMM and MU EDCA, Spatial Reuse, and the AP name that thirteen vendors broadcast in their own element. Right-click to copy one element or the whole tree.
Alerts
Auto-generated, rule-based findings about the selected network: weak security, DFS instability, BSS Color collisions, channel-14-outside-Japan, and dozens more. Filter by Category or Priority; each card can link to a support article. These same findings can be emailed automatically. See Settings → Alerts & Reports.
Priority runs Very High → High → Medium → Low → Very Low, plus two special tiers: Alert (reserved for genuinely severe/actionable findings) and Info for findings that describe a good or neutral configuration state (e.g. "WPA3 clients use SAE and are required to use 11w"), informational only, and never emailed, even with alert emails turned on.
Clients
Client devices seen talking to (data frames) or probing for (probe requests) the selected network, not the same as the AP's own self-reported station count, which is what the grid's Station Count column shows.
This tab is fed only by monitor-mode frames, so it fills from an RFMON capture or an imported packet capture. A normal Wi-Fi adapter scan sees beacons and probe responses only and can never produce client traffic, so with a Wi-Fi adapter selected as the scan source the tab is expected to stay empty and says so.
Alerts Drawer (side panel)
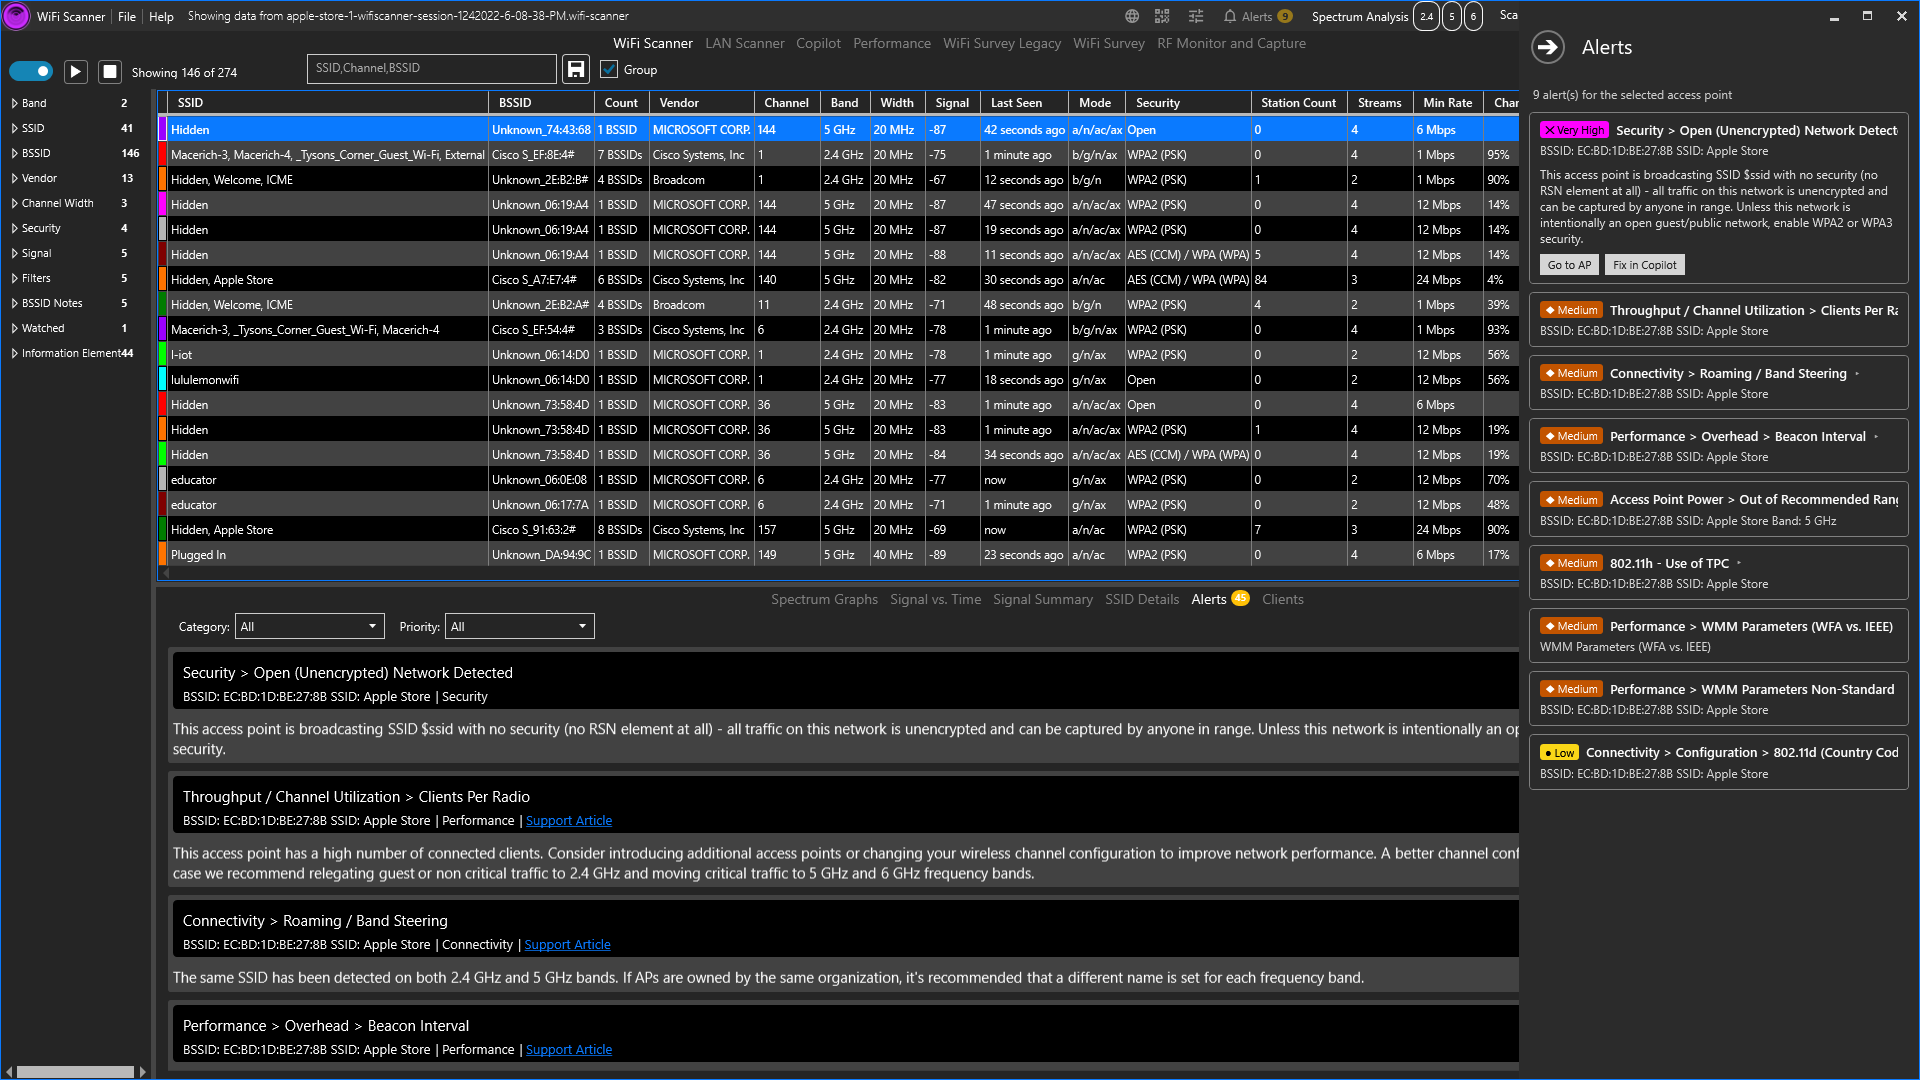
A second way to reach the same findings as the Scan tab's Alerts sub-tab,
without switching away from whatever you're currently looking at (Performance, WiFi Survey, Copilot).
Click the bell icon in the title bar (the badge on it shows a live count for the
currently-selected AP) to slide it open from the right; it stays in sync with the same
DetectedAlertsAP data the in-grid Alerts panel shows, so the two never disagree.
- Click a card's header to expand it in place. The chevron flips from ▸ to ▾, and the card grows to show the full remediation text plus two action buttons.
- Go to AP: selects that finding's BSSID back in the Scanner grid and closes the drawer, so you land straight on the row instead of hunting for it yourself. If the AP has aged out of the current scan, a small toast says so instead of silently doing nothing.
- Fix in Copilot: jumps to the Copilot tab and runs whichever Go-card report best matches the finding's category (Security → Security check, a channel/interference finding → Fix channel congestion, a roaming/connectivity finding → Check roaming readiness, anything else → Check an SSID against best practices), pre-filled with the alert's own SSID. The drawer becomes an entry point into a real report instead of a dead end.
Copilot Tab: Outcome Cards & AUTO Reports
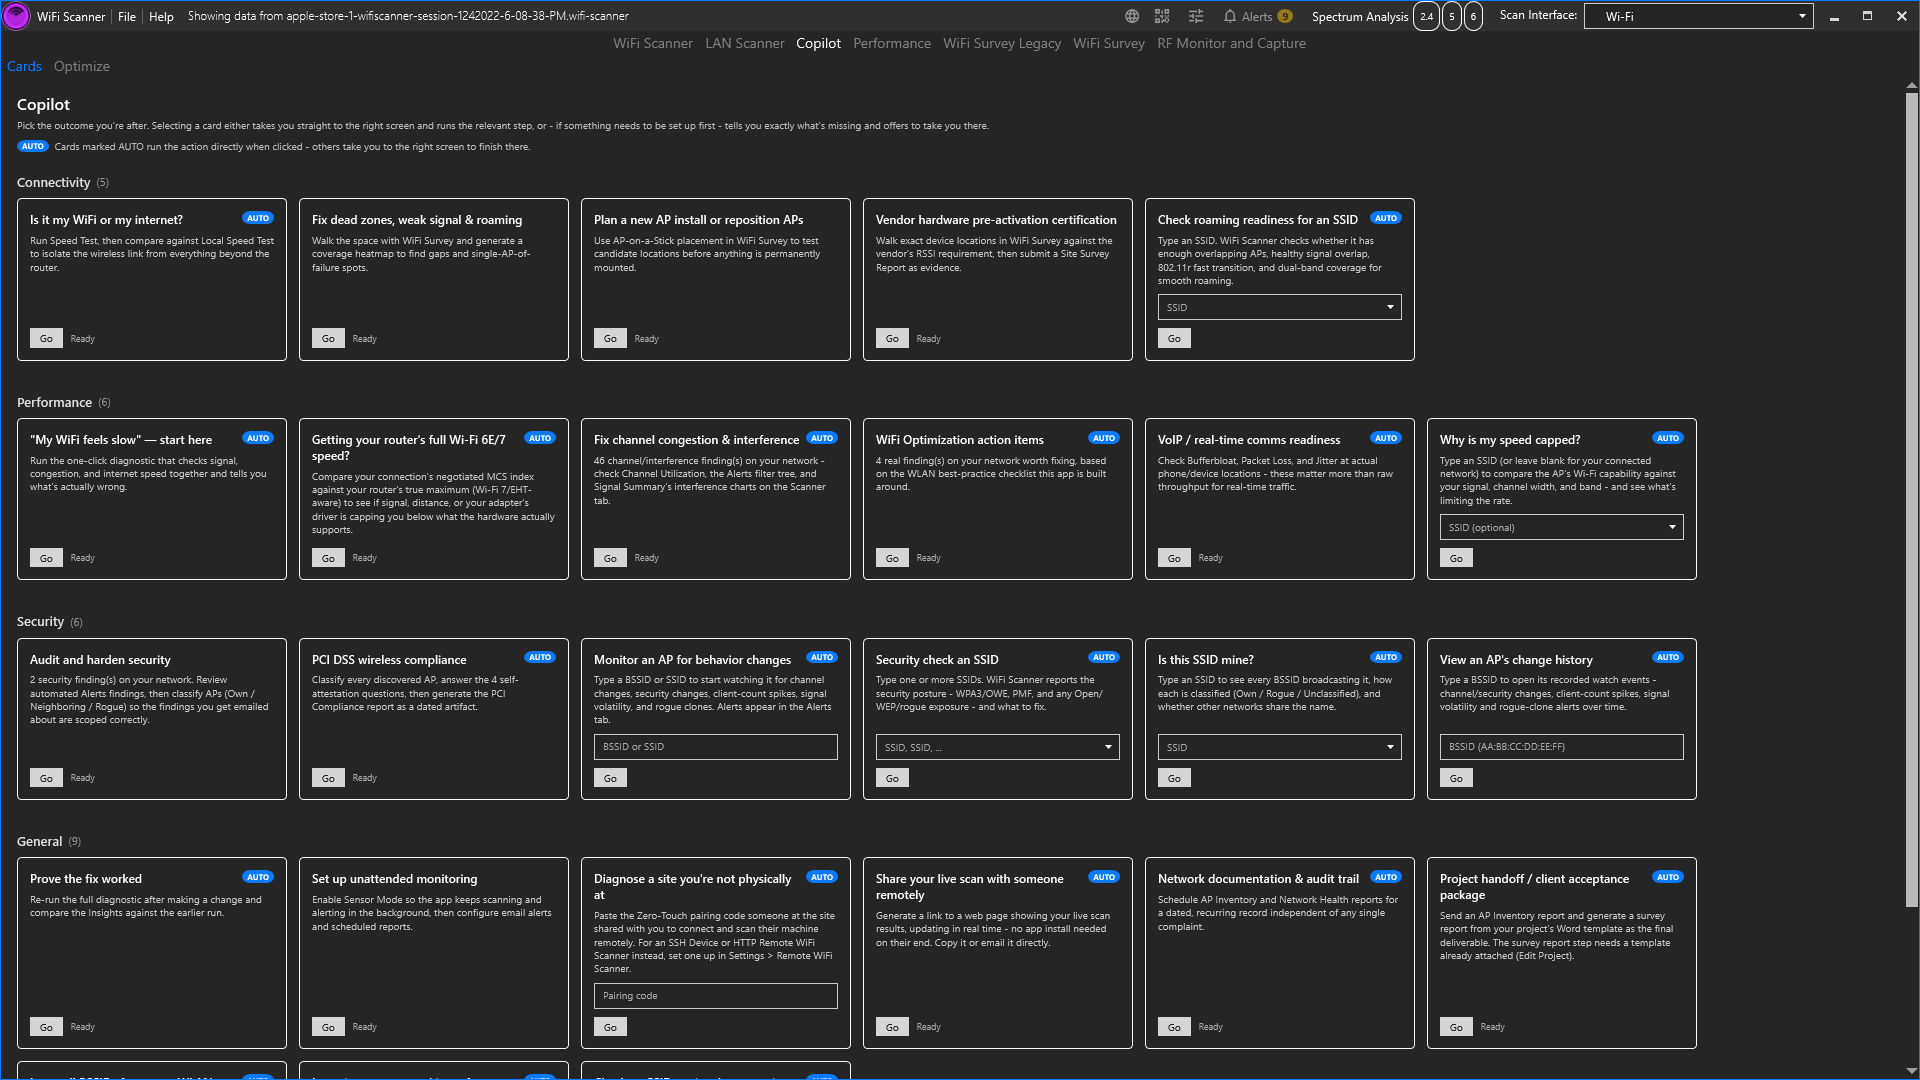
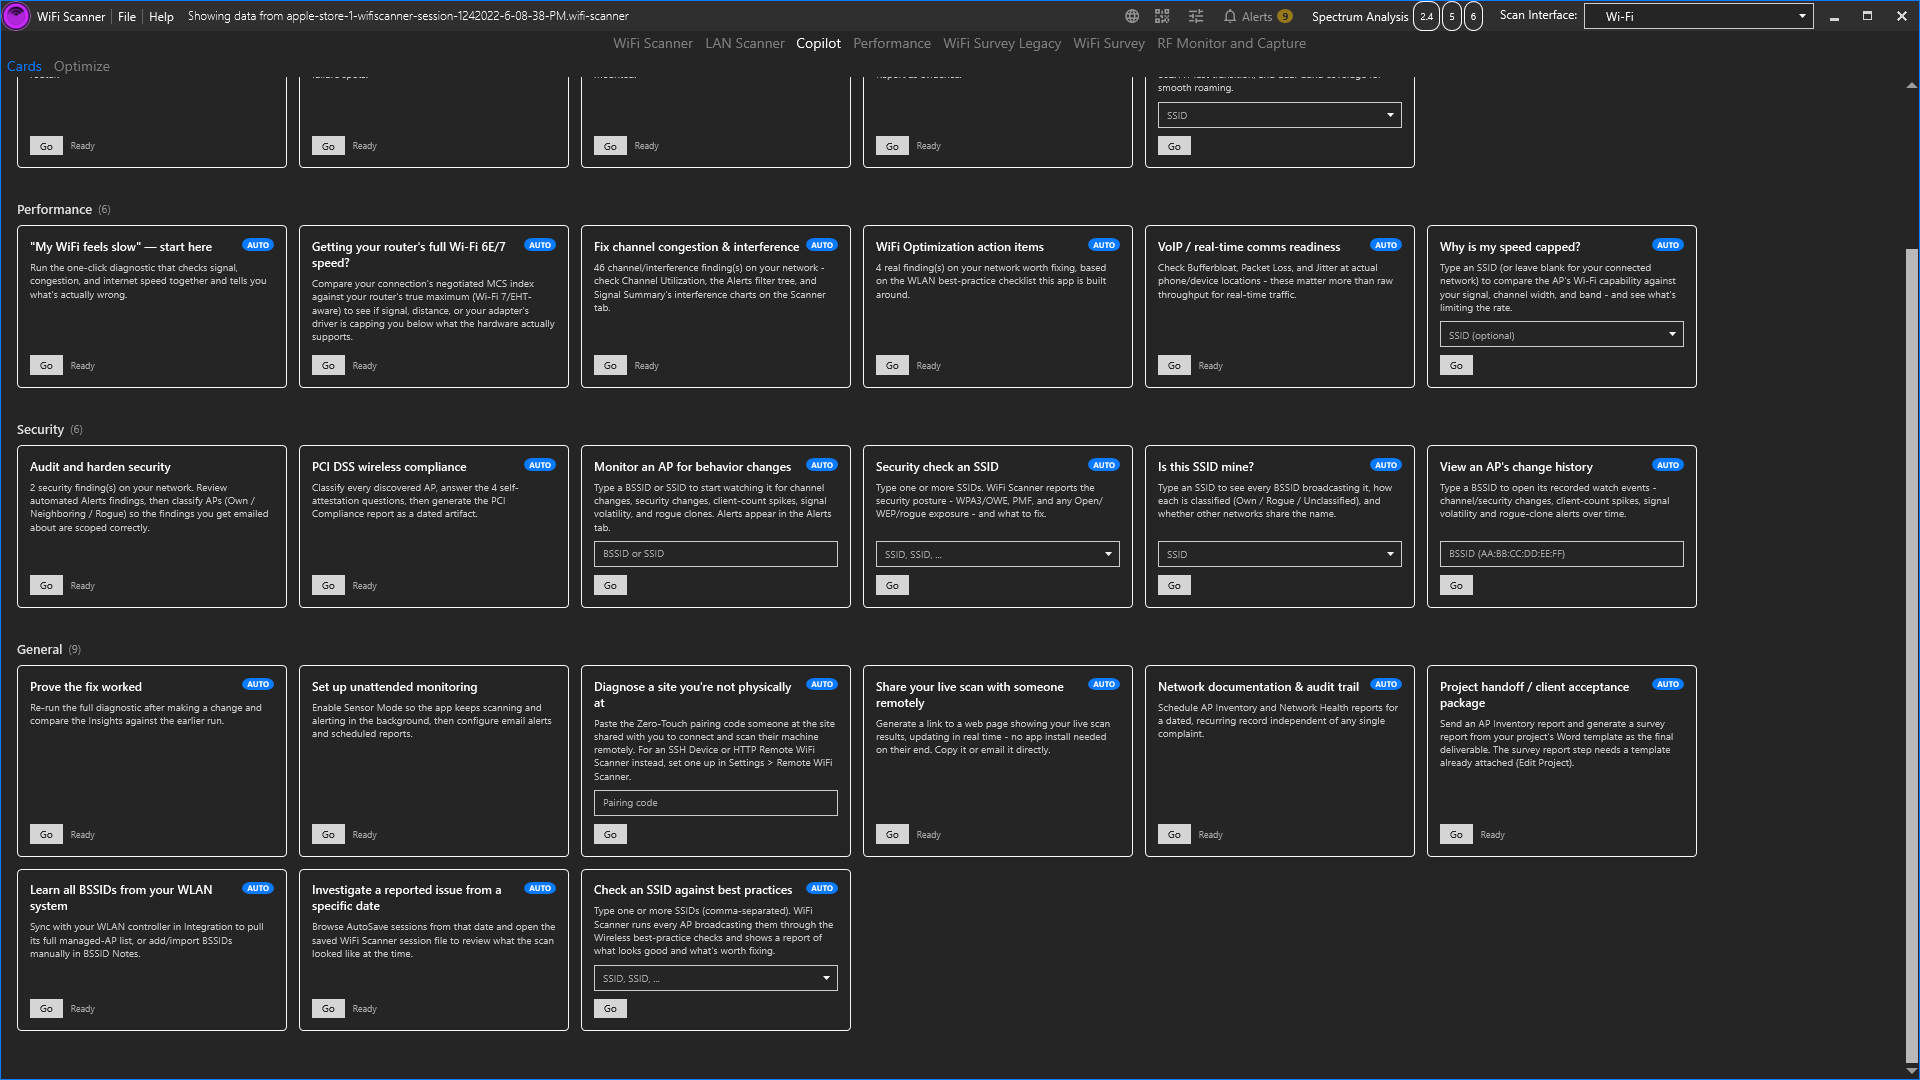
A card reads Ready once its prerequisite is met (e.g. an Own-classified AP exists, an integration is configured) and greys out with the specific reason why when it isn't yet.
Cards tagged AUTO run their action directly with one click (a diagnostic, a sync, a connection, or a full report) instead of just navigating you to the right screen to finish the steps yourself. Several of these generate a real report window on the spot, reusing the same generalized report engine (title/description/unit vary per report, the layout and Good/Bad-findings format are shared):
WiFi Checker sub-tab
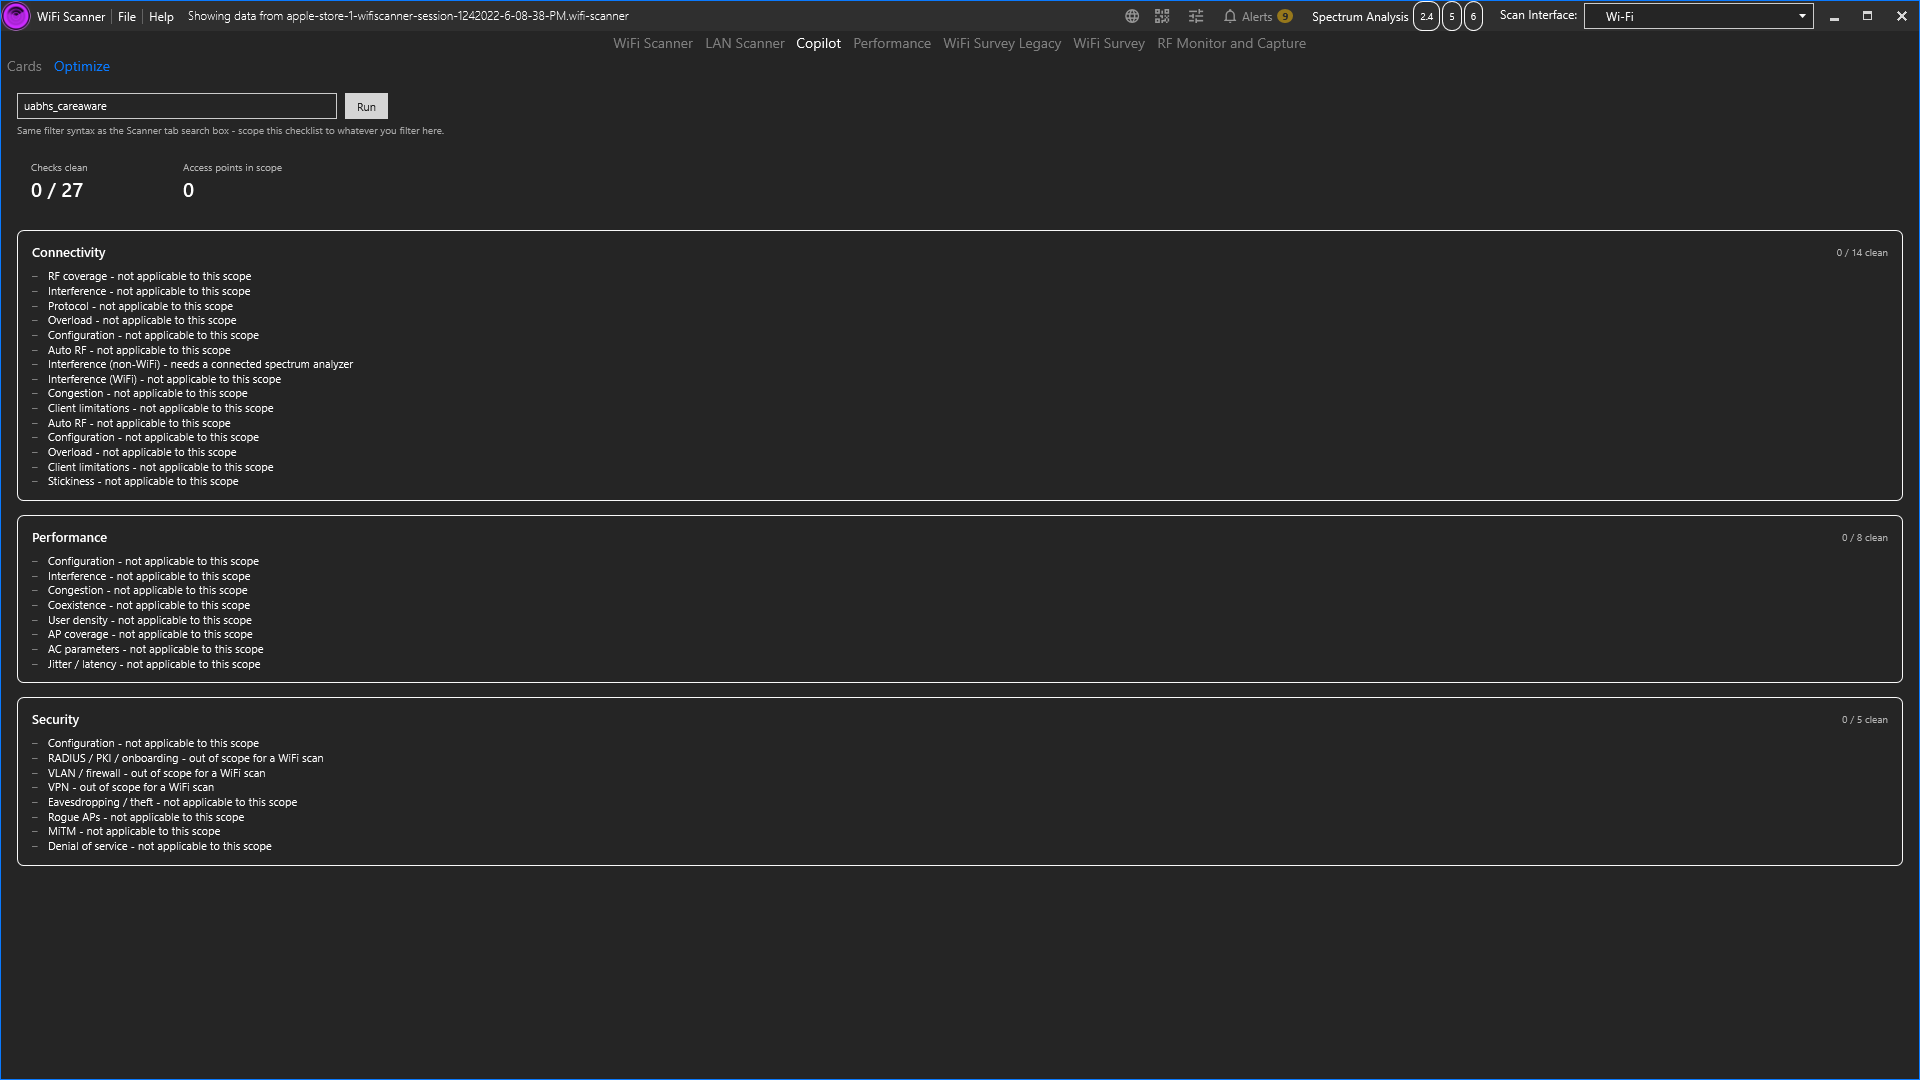
| Card | What it does |
|---|---|
| Check an SSID against best practices | Runs every AP broadcasting the SSID(s) you type through WiFi Scanner's general best-practice checklist and shows what's good and what's worth fixing. |
| Security check an SSID | Type an SSID, or a BSSID to check the network it belongs to. Reads the security each BSSID broadcasting that network advertises in its beacon: Open, WEP, WPA, WPA2, WPA3 or Enhanced Open, whether it still offers TKIP, and whether it requires Protected Management Frames (PMF). Lists every BSSID with what it found, and flags open or WEP access, TKIP, security it cannot recognise, missing WPA3 and missing PMF. The same checks, in the same words, as on macOS. |
| Check roaming readiness | Type an SSID, or a BSSID to check the network it belongs to (matching ignores case). Checks that the network has more than one AP radio, that at least two of them are at or above -70 dBm so a client can hand off between them, whether its BSSIDs advertise 802.11k, 802.11r and 802.11v - all of them, some, or none - and whether it is dual-band. The same checks, in the same words, as on macOS. |
| VoIP / real-time comms readiness | Type an SSID or BSSID, or leave it blank for the network you are connected to. Checks it against voice best practice from the Wireless Adjuster course: signal of −65 dBm or better on 5/6 GHz and −67 dBm on 2.4 GHz, channel utilisation under 20%, 802.11r, 802.11k and 802.11v on every BSSID, WMM on, no TKIP or WEP, a minimum basic rate of 12 Mbps and at most five SSIDs per radio. It adds your latest latency, jitter and loss from the network quality monitor against voice targets (under 150 ms one-way, 30 ms and 1%). The same checks, in the same words, as on macOS. |
| PCI DSS wireless compliance | Checks that at least one AP is classified Own and all eight PCI self-attestation questions are answered (it takes you to the right Settings tab if not), then saves the PCI DSS wireless compliance report as a dated PDF where you choose and opens it. Emailing and scheduling the report stay in Settings > Alerts & Reports. The same on macOS. |
| WiFi Checker | Opens the WiFi Checker sub-tab over the whole scan. The card shows how many high-priority findings your own APs have. |
| Why is my speed capped? | Type an SSID or BSSID, or leave it blank for the network you are connected to. Reads the AP's Wi-Fi generation, channel width, spatial streams and maximum rate from its beacon, for the BSSID you typed, else the one you are connected to, else the strongest, and says whether weak signal (-75 dBm or below), a narrow channel on 5 or 6 GHz, or 2.4 GHz is limiting it. When you are connected it also shows your link rate, which is not your internet speed. Every other BSSID on the network is listed with the same facts. The same checks, in the same words, as on macOS. |
| Is this SSID mine? | Type an SSID, or a BSSID to check the network it belongs to. Lists every BSSID broadcasting that network with its classification and vendor; flags any classified Rogue, and any unclassified BSSIDs using a name you own (either more of your APs or an impersonator); and warns when a different vendor is using your network's name, or when two vendors share a name nobody has claimed yet. Vendors are compared by company, so Cisco and Cisco Meraki count as one. The same checks, in the same words, as on macOS. |
| View an AP's change history | Opens a BSSID's recorded watch events (channel/security changes, client-count spikes, signal volatility, roaming clones). Reuses the same window as BSSID Notes's Events button. |
| Monitor an AP for behavior changes | Starts a watch on a typed BSSID or SSID directly, without finding it in the grid first. |
| Investigate a reported issue from a specific date | Opens the AutoSave session browser straight to a specific date, skipping the trip through Settings. |
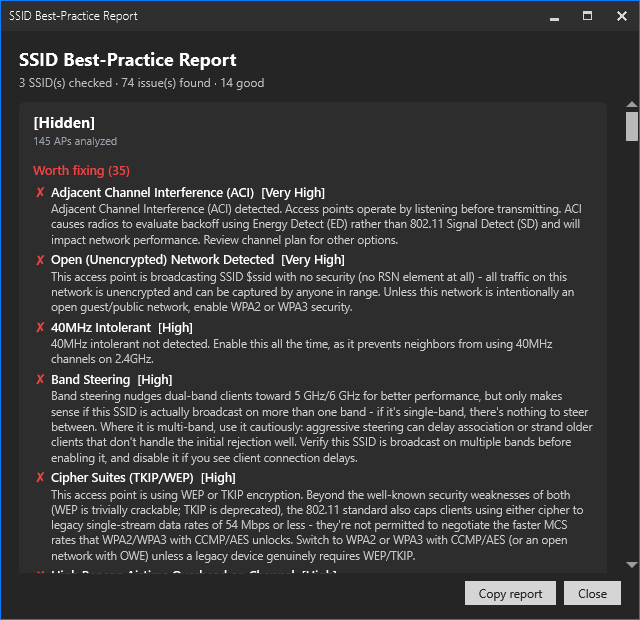
Fix channel congestion runs its advisor and opens a report directly instead of just pointing at a tab.
Why does my connection drop? names the conditions in the air that cause a drop, each with its evidence: a signal at the edge, nowhere to roam to when this AP fades, a DFS channel (the one cause that disconnects every client at the same instant), a saturated channel, too many clients on the radio, crowding, or 2.4 GHz when the network also broadcasts elsewhere. If none of them apply it says so - the cause is not visible from the air. A scan sees the air, not your association, so the card cannot tell you a drop happened; watch the BSSID and read its change history for that.
WPA3 & PMF readiness places every BSSID of a network on the road to WPA3 - no protection, original WPA, WPA2 without PMF, WPA2 with PMF, transition mode, WPA3 - and names the one next step, which is whatever the furthest-behind BSSID needs. Open or WEP is the step in front of WPA3 rather than a WPA3 question; TKIP has to go first, because WPA3 forbids it and PMF cannot be enabled alongside it; PMF goes on as capable before required, so no client is evicted. It also says when the BSSIDs of one network disagree, and when a 6 GHz radio runs without the WPA3 and PMF that band requires.
Is my channel too wide or too narrow? takes an SSID or BSSID, or a blank field for the network you are connected to, and weighs the width that AP is running against the company it keeps. Width is a trade - every doubling doubles the rate and halves how many channels fit - so it compares: what the next width up would add in overlapping APs, and what the next width down would shed. On 2.4 GHz it needs no comparison, because the band has room for three non-overlapping channels and nothing wider fits. A second radio of the same AP never counts as its own neighbour.
Is it my WiFi or my internet? answers with three numbers, in the order the bits travel: the rate your radio agreed, what actually crossed the air to your router (the local throughput test), and what reached the internet. Each step can only lose speed, so the one that loses the most is the answer. The air is not expected to carry the whole negotiated rate - about half of it is a healthy result over TCP - so the two legs are scored against what each should manage before either is blamed. Bufferbloat and packet loss are reported alongside when the speed test measured them.
Getting your router's full Wi-Fi 6E/7 speed? takes an SSID or BSSID, or a blank field for the network you are connected to. It names the fastest radio that network has in range, says whether it is 6E (a 6 GHz radio) or Wi-Fi 7 (the generation, which can also appear on 5 GHz) or neither, and then measures your own link against what that radio can do. When your link exactly equals what a narrower channel or fewer streams would give, it says so - that ceiling is your adapter, not the AP. When it matches none of them, the modulation is being cut by the air rather than by capability. A weak signal is named ahead of both. The same checks, in the same words, as on macOS.
Fix channel congestion & interference recommends the least busy channel on each band. It counts physical AP radios rather than SSIDs, weighs each by its signal, and on 5 and 6 GHz counts a radio against every channel its width covers, so an 80 MHz neighbour makes four channels busy, not one. On 2.4 GHz it chooses between 1, 6 and 11, counting a 40 MHz radio's second half as well. It then flags up to three other crowded channels (three or more radios; six or more is high). On 5 and 6 GHz it picks from every channel the beacons' own Country element says your country allows, not just the ones in use, so it can send you to a channel nobody is on; with no Country element it falls back to the channels in use and says to check what is allowed. A DFS channel (5 GHz 52 to 144) is recommended when it wins - far fewer networks use them - and the least busy channel that is not DFS is named alongside it, for an AP that cannot detect radar. The same checks, in the same words, as on macOS.
Performance → Connection Summary
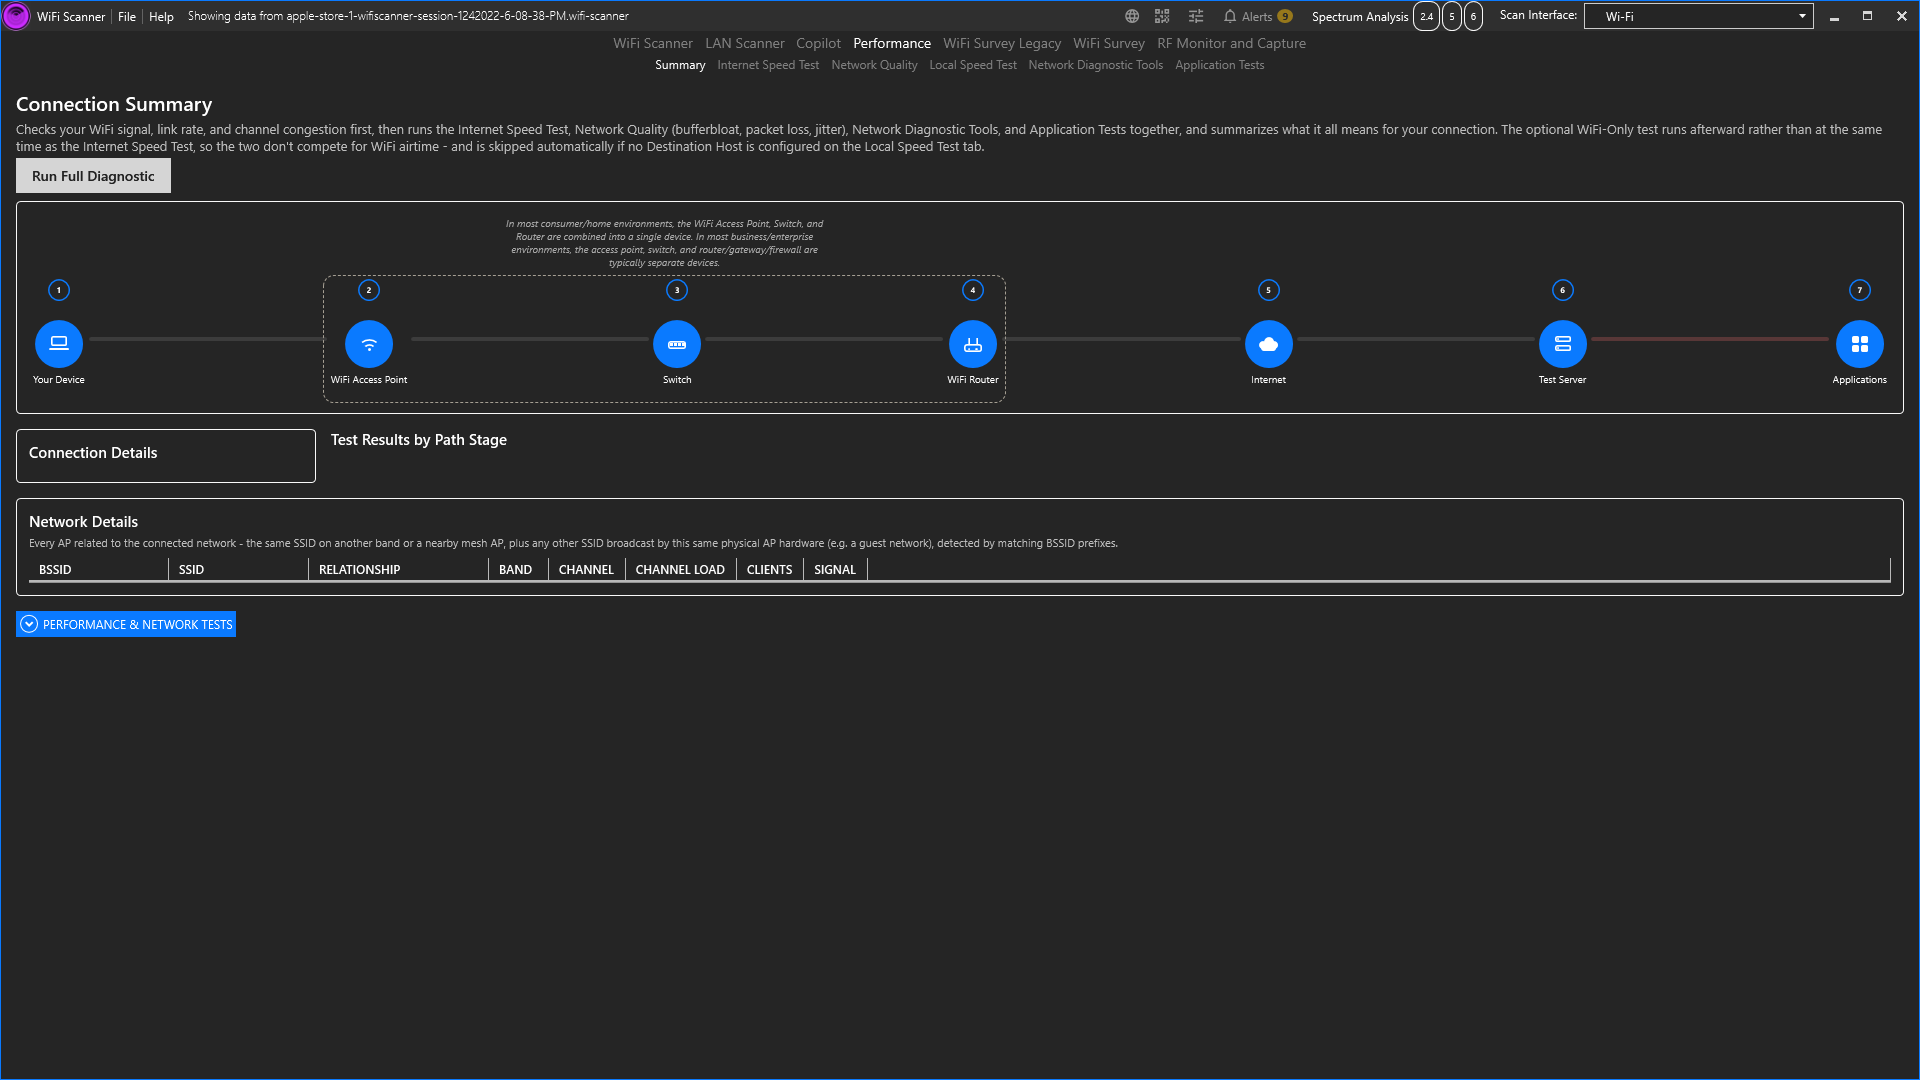
The single most useful button in the app for a fast site-visit read: Run Full Diagnostic runs, in order, local WiFi signal/link-rate/channel-congestion checks, then Speed Test + Network Diagnostics + Application Tests concurrently, then the WiFi-Only test last (so it doesn't compete for airtime with the others).
As it runs, the signal-path diagram animates which hop is currently being probed: Your Device → WiFi Access Point → WiFi Router → Internet → Test Server → Applications, each node showing live detail (connected SSID, router LAN/WAN IP, your ISP's first-hop IP via a TTL=2 ping trick). The Applications node is clickable and shows a colored dot per app suite (green = fully reachable, red = a problem). Hover for the per-endpoint breakdown.
Below that: an Insights list of plain-English findings ("Weak WiFi signal, try moving closer to the router", "Noticeable bufferbloat", "Your WiFi hop measured 450 Mbps locally, well above what you got to the internet: the bottleneck looks like your internet connection, not your WiFi", "Negotiated at MCS 9, well below this AP's maximum of MCS 13; signal, distance, interference, or your adapter's own capability may be capping the connection"), a Connection Details fact sheet, and a Network Details table listing every AP related to the one you're connected to (same SSID on another band, mesh siblings, a guest network on the same hardware), useful for diagnosing roaming/mesh placement or spotting an unexpected SSID riding on the same radio.
Performance → Internet Speed Test
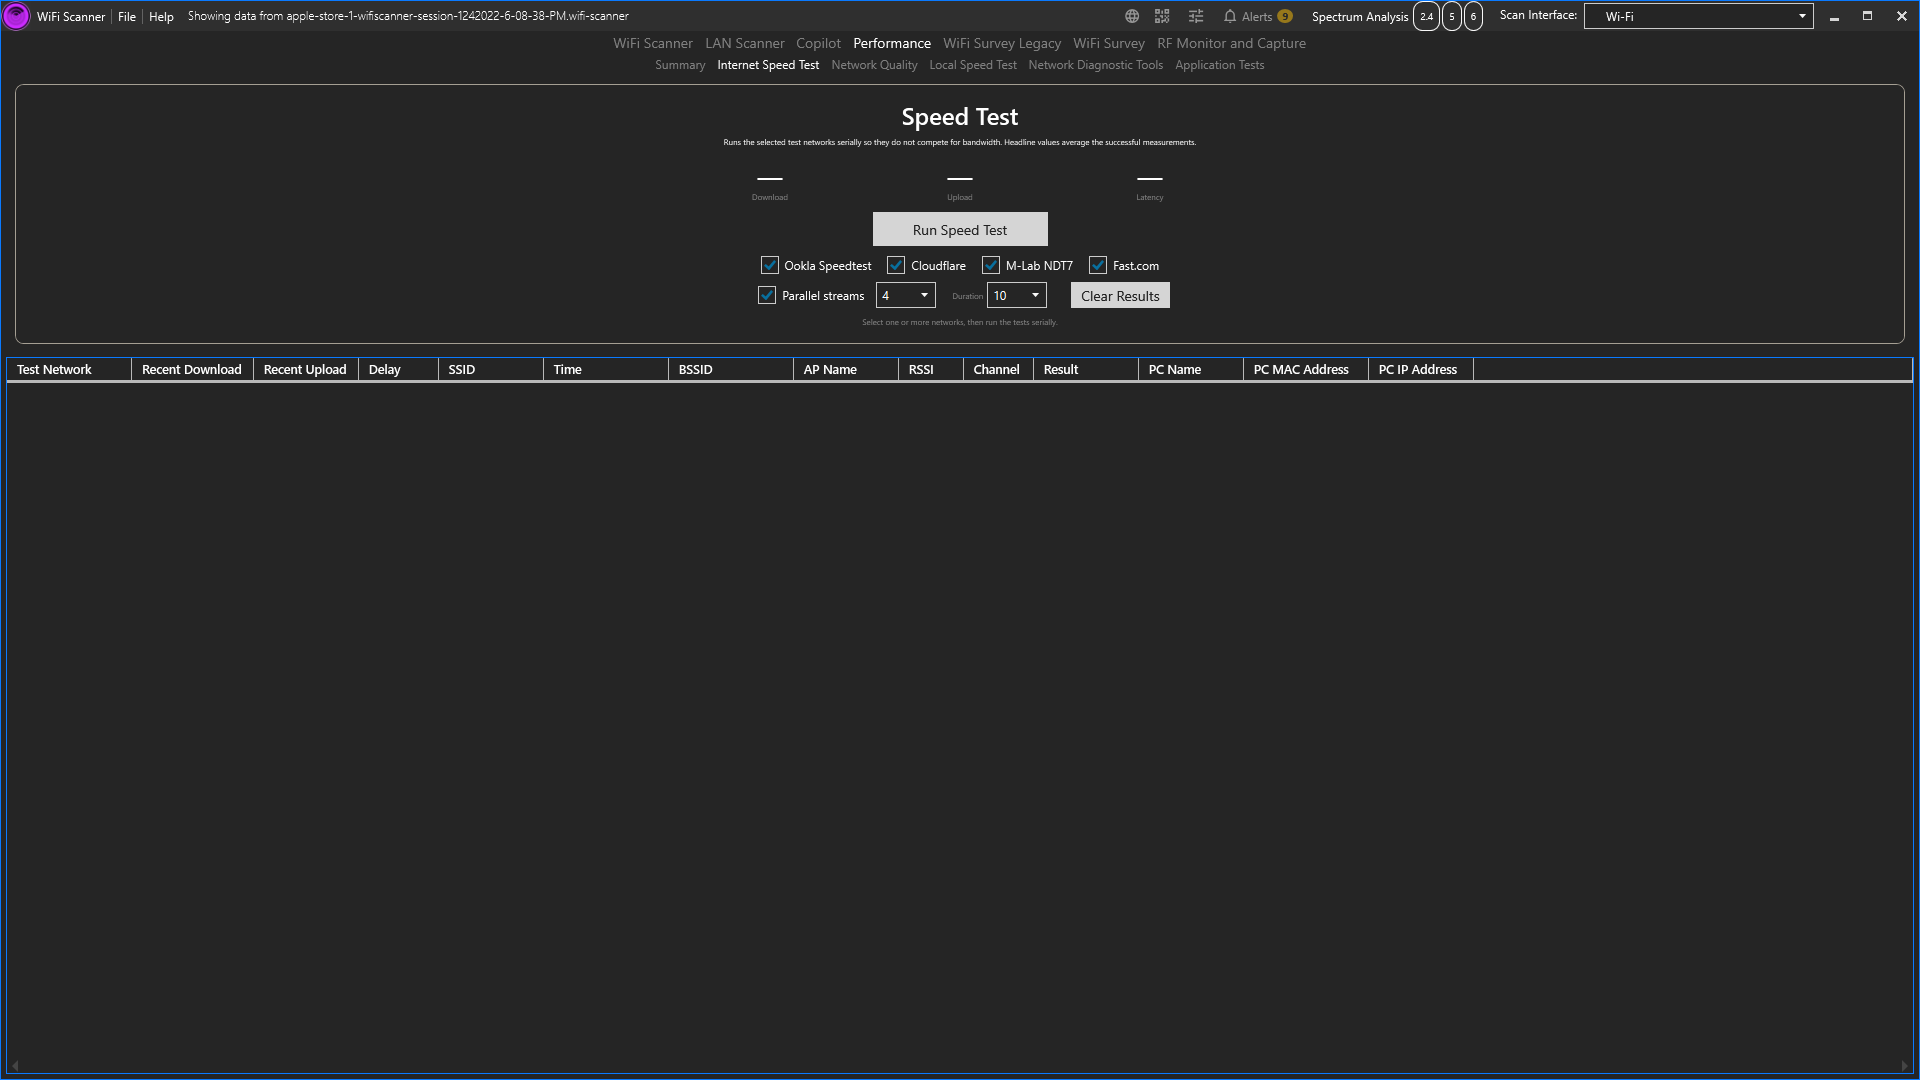
The main manual "run a speed test now" screen. Tick which of the four providers to measure (Ookla Speedtest, Cloudflare, M-Lab NDT7 and Fast.com) and click Run Speed Test; they run one after another so they never compete for bandwidth, a live gauge and download/upload/latency readouts follow the run, and the headline numbers average the providers that succeeded. Every result is logged to a results grid (17 possible columns, right-click a header to choose which show) and plotted on a trend graph across the session, so you can see if speed is degrading as you move through a building or over time. Clear Results empties the grid and the graph.
Every provider is measured the same way. Each direction runs for a fixed Duration (5 to 30 s, default 10) over the number of Parallel streams you choose (2 to 16, or untick it for a single connection), with the first two seconds excluded while TCP ramps up. That is how the providers' own apps measure, and it is why the four used to disagree wildly here: a single download of a fixed-size file was being compared against a multi-stream fixed-time test. Run Full Diagnostic on the Connection Summary tab uses the same settings and the providers you have ticked, and its report names which provider produced the speed it shows.
Performance → Network Quality
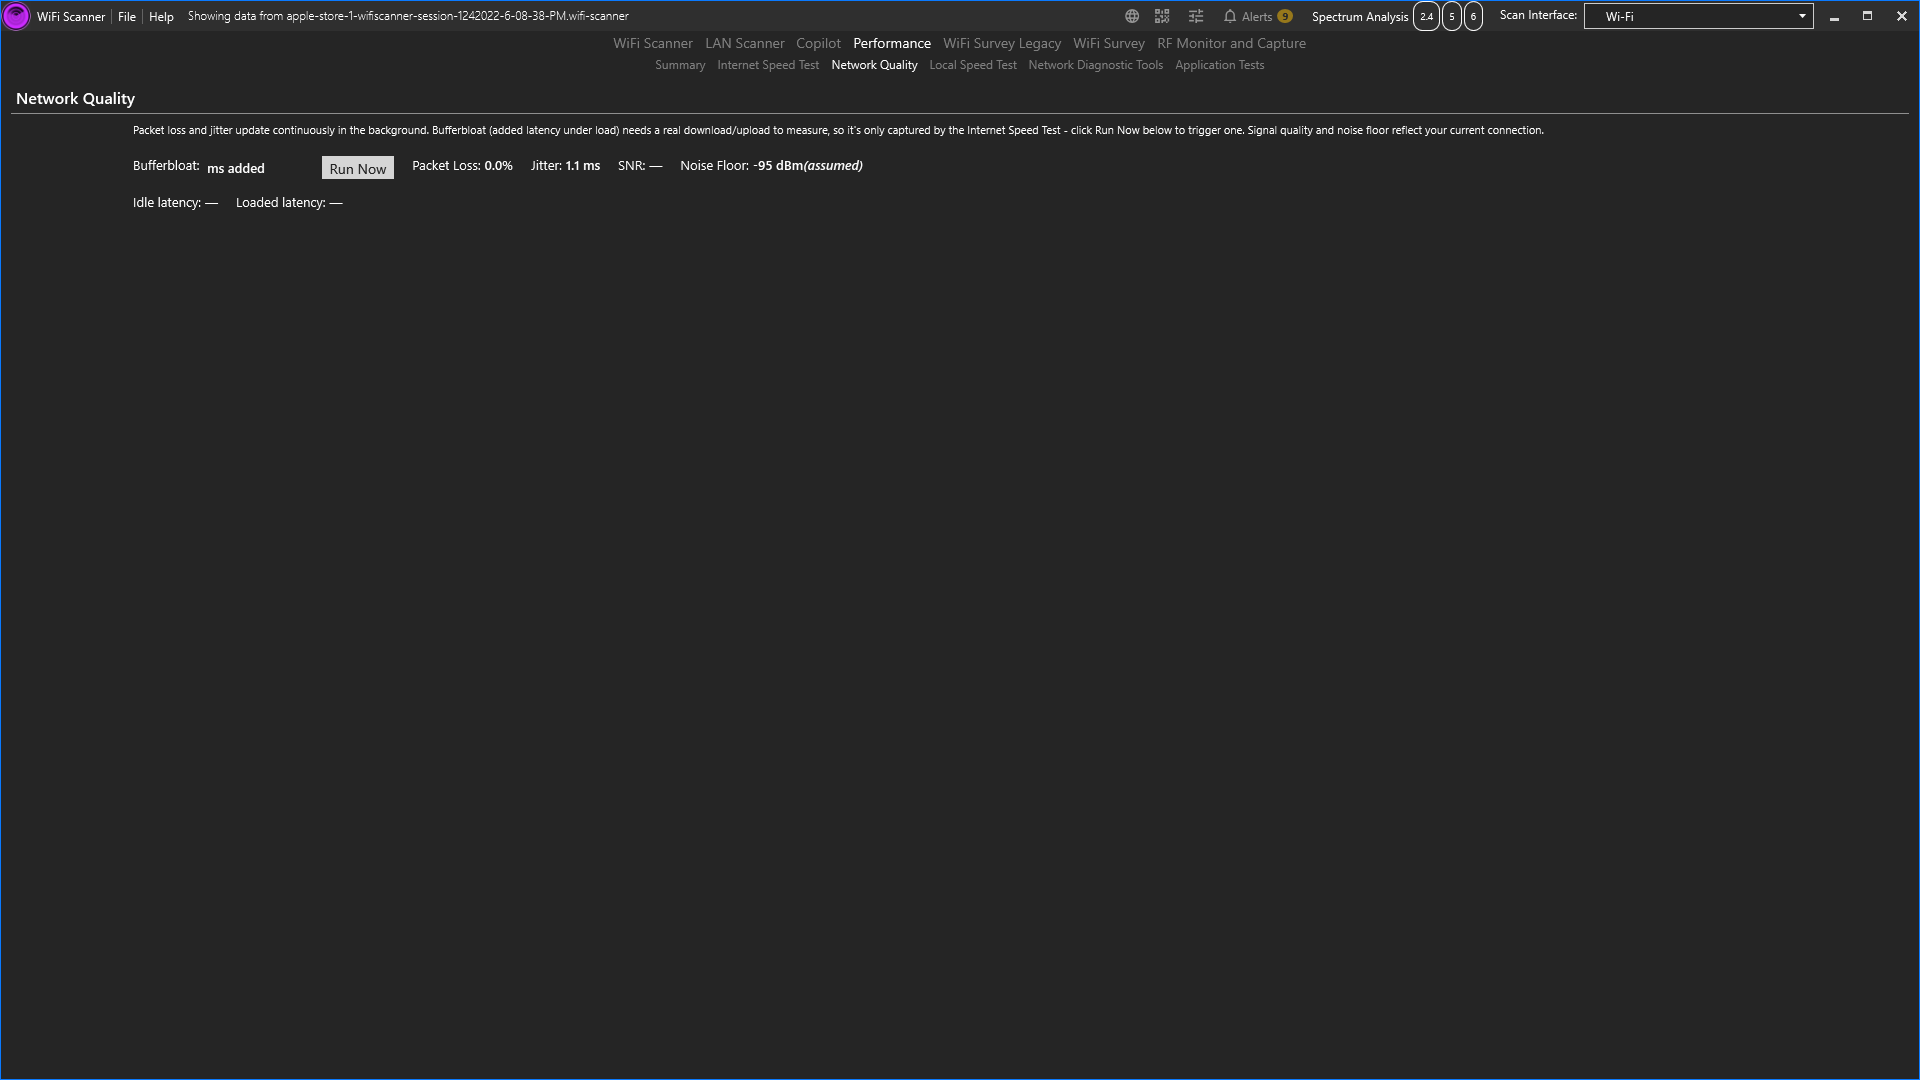
A live, continuously-updating readout, with nothing to click here. Bufferbloat is extra latency added only while the link is saturated (e.g. during a big download); high values mean video calls or gaming will stutter specifically when the connection is busy, a classic router-queue/QoS problem. Packet Loss and Jitter matter most for calls/gaming. Signal Quality and Noise Floor reflect your current WiFi connection. A low signal-to-noise ratio causes retries and slowdowns even when signal strength alone looks fine.
Performance → Local Speed Test
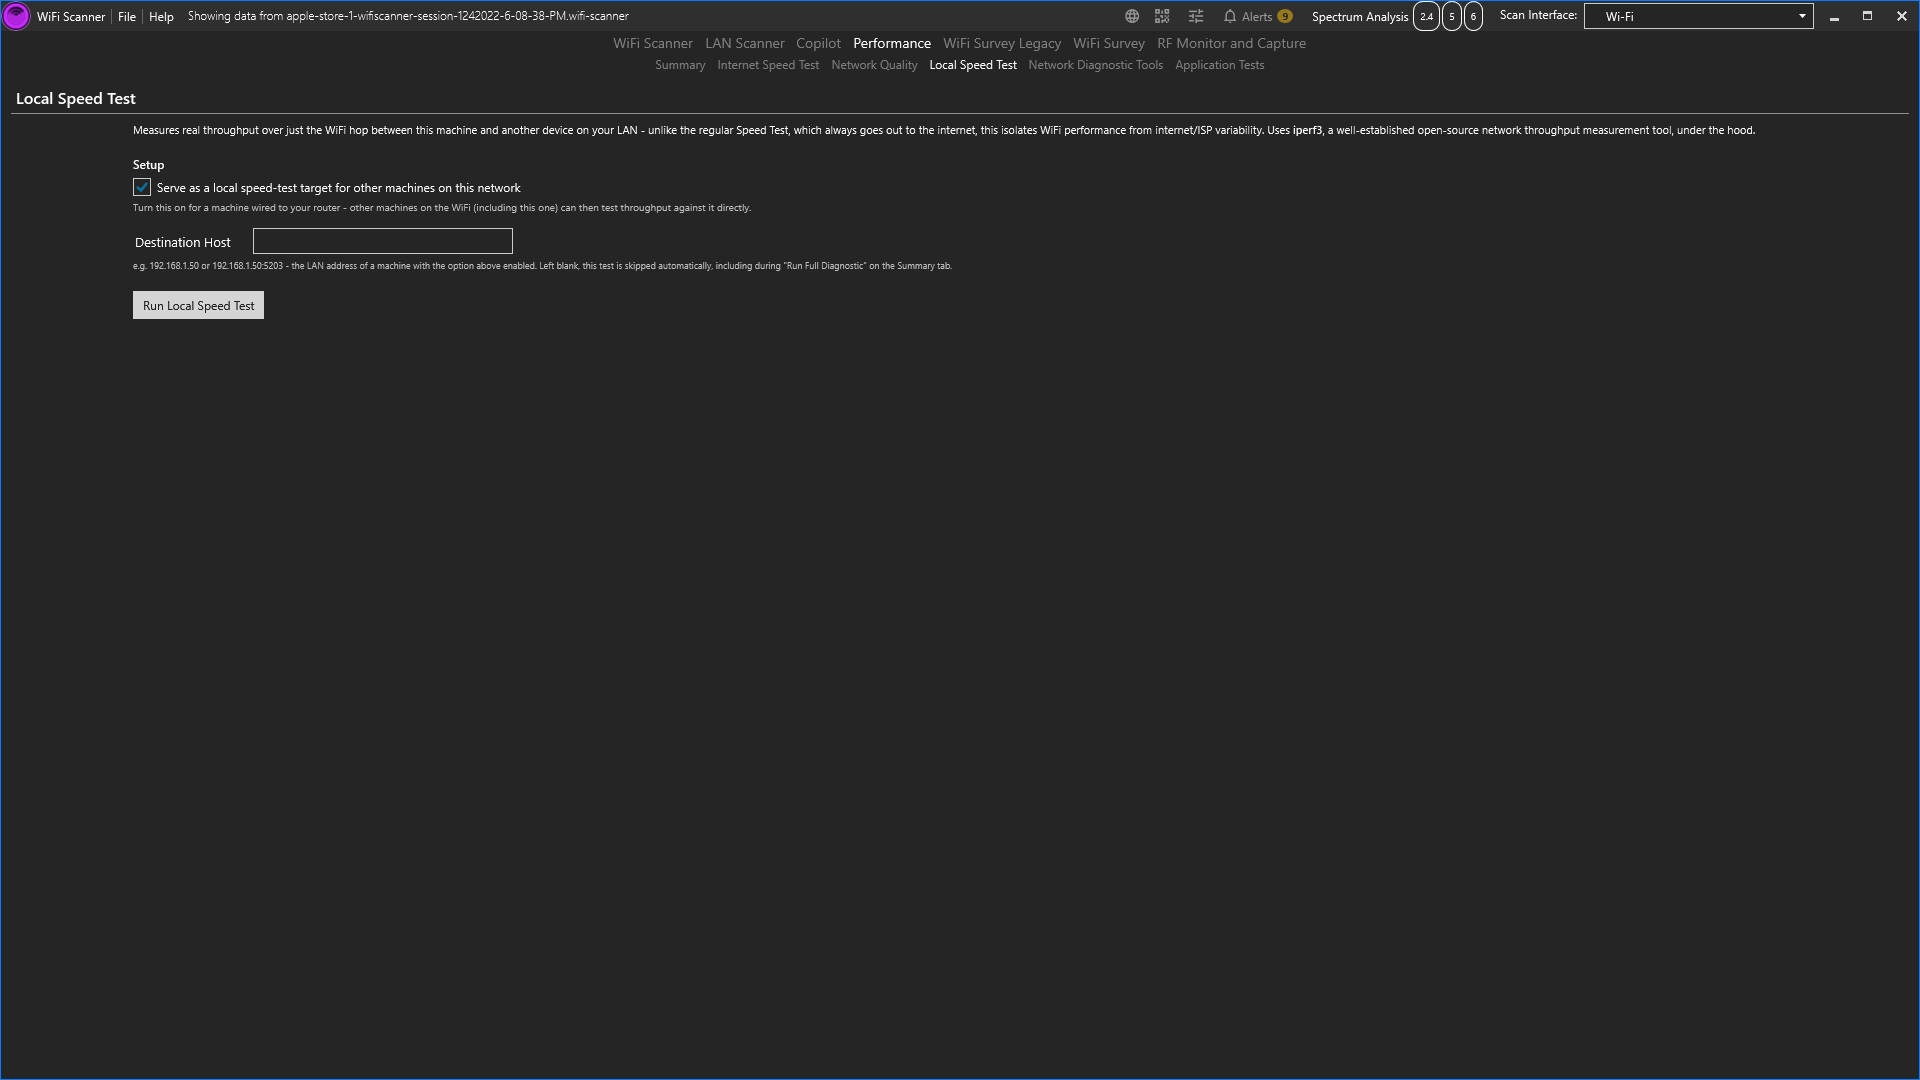
Answers the question "is it my WiFi, or my internet service?" by measuring throughput over just the WiFi hop using iperf3, isolating the wireless link entirely from the WAN. To use it: enable "Serve as a local speed-test target" on one machine that's wired directly to the router, then enter that machine's IP as the Destination Host on any WiFi client (including itself) and click Run Local Speed Test. Leave the Destination Host blank and this test is silently skipped everywhere, including during Run Full Diagnostic.
Performance → Network Diagnostic Tools
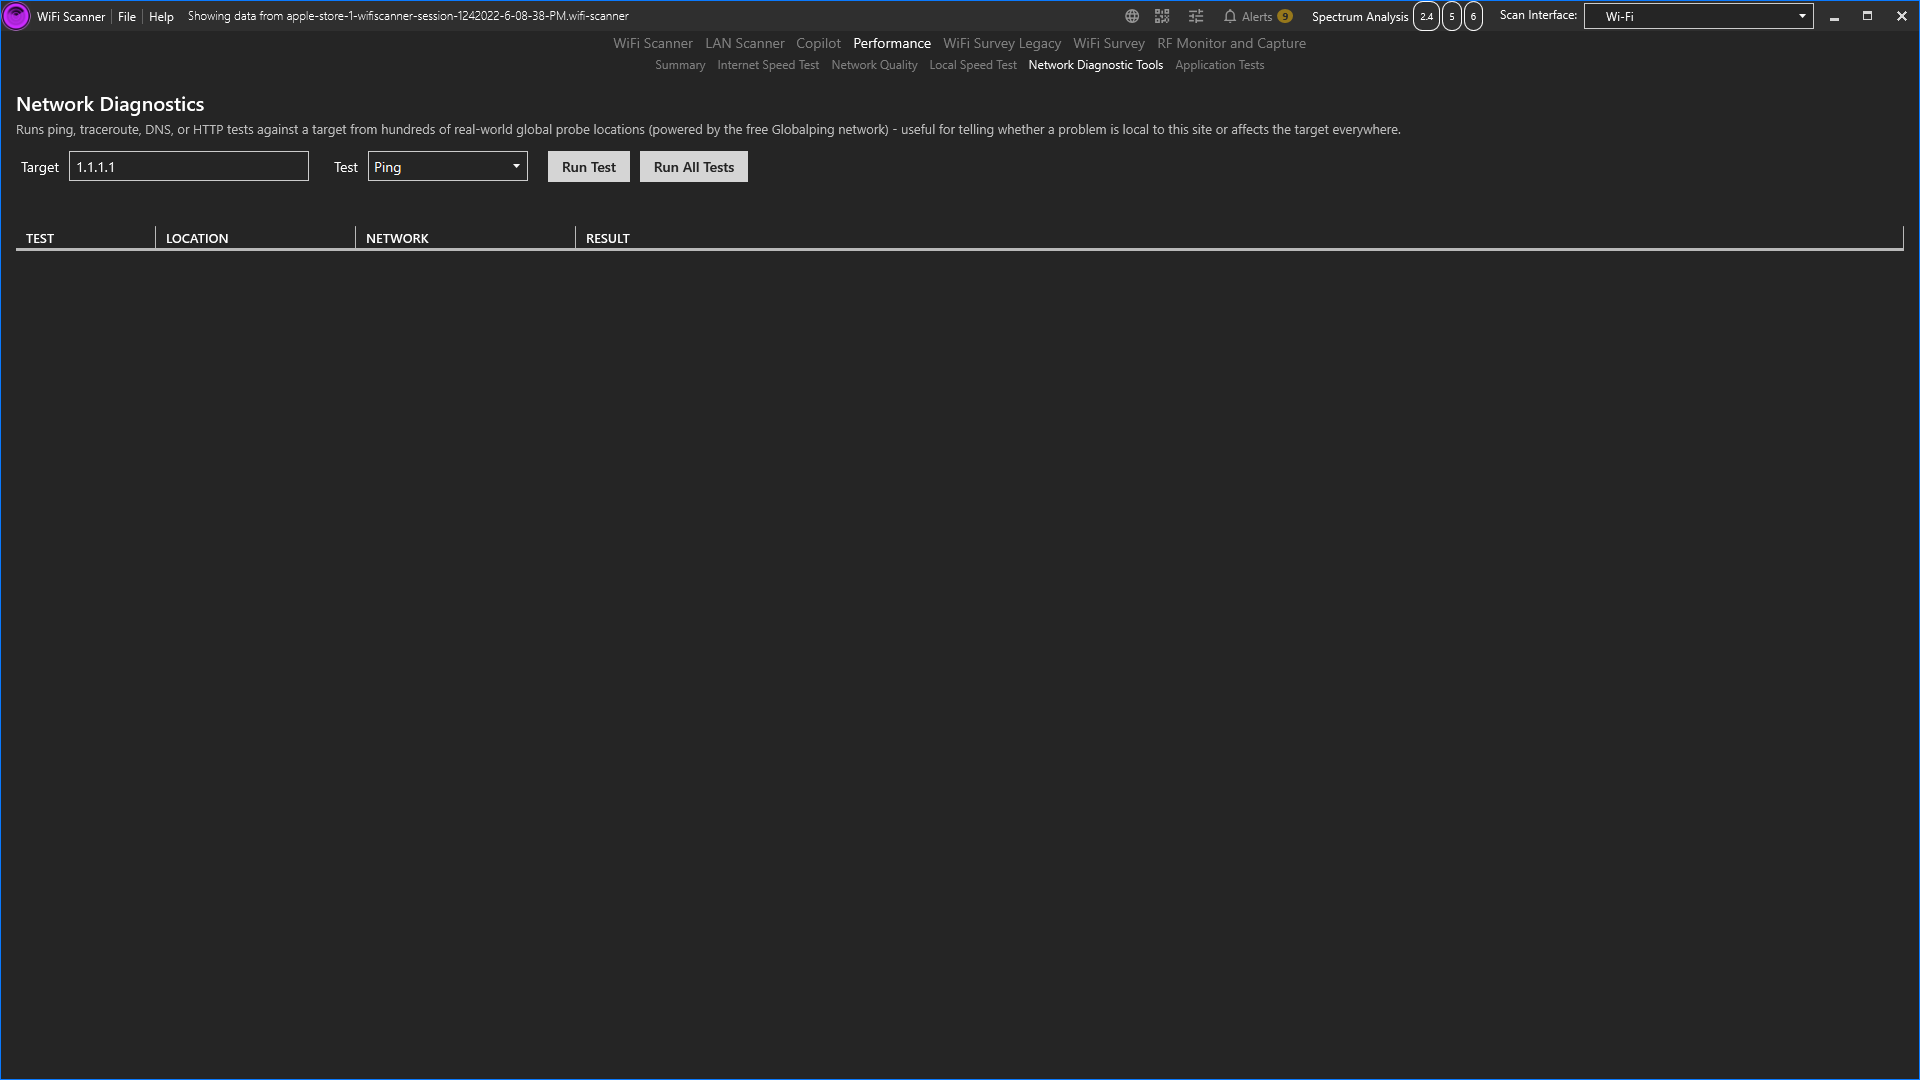
Runs Ping, Traceroute, DNS Lookup, or HTTP (with a full DNS/TCP/TLS/first-byte timing breakdown) against any hostname or IP, from real probe machines in dozens of countries, not just from where you're standing. This is how you tell whether a problem is specific to the site you're at, or affects the target everywhere: if a customer's mail server is slow from here but fast from five other global locations, the problem is local (their ISP, their site network); if it's slow everywhere, the problem is on the server/target side. Run All Tests runs all four types in one pass.
Performance → Application Tests
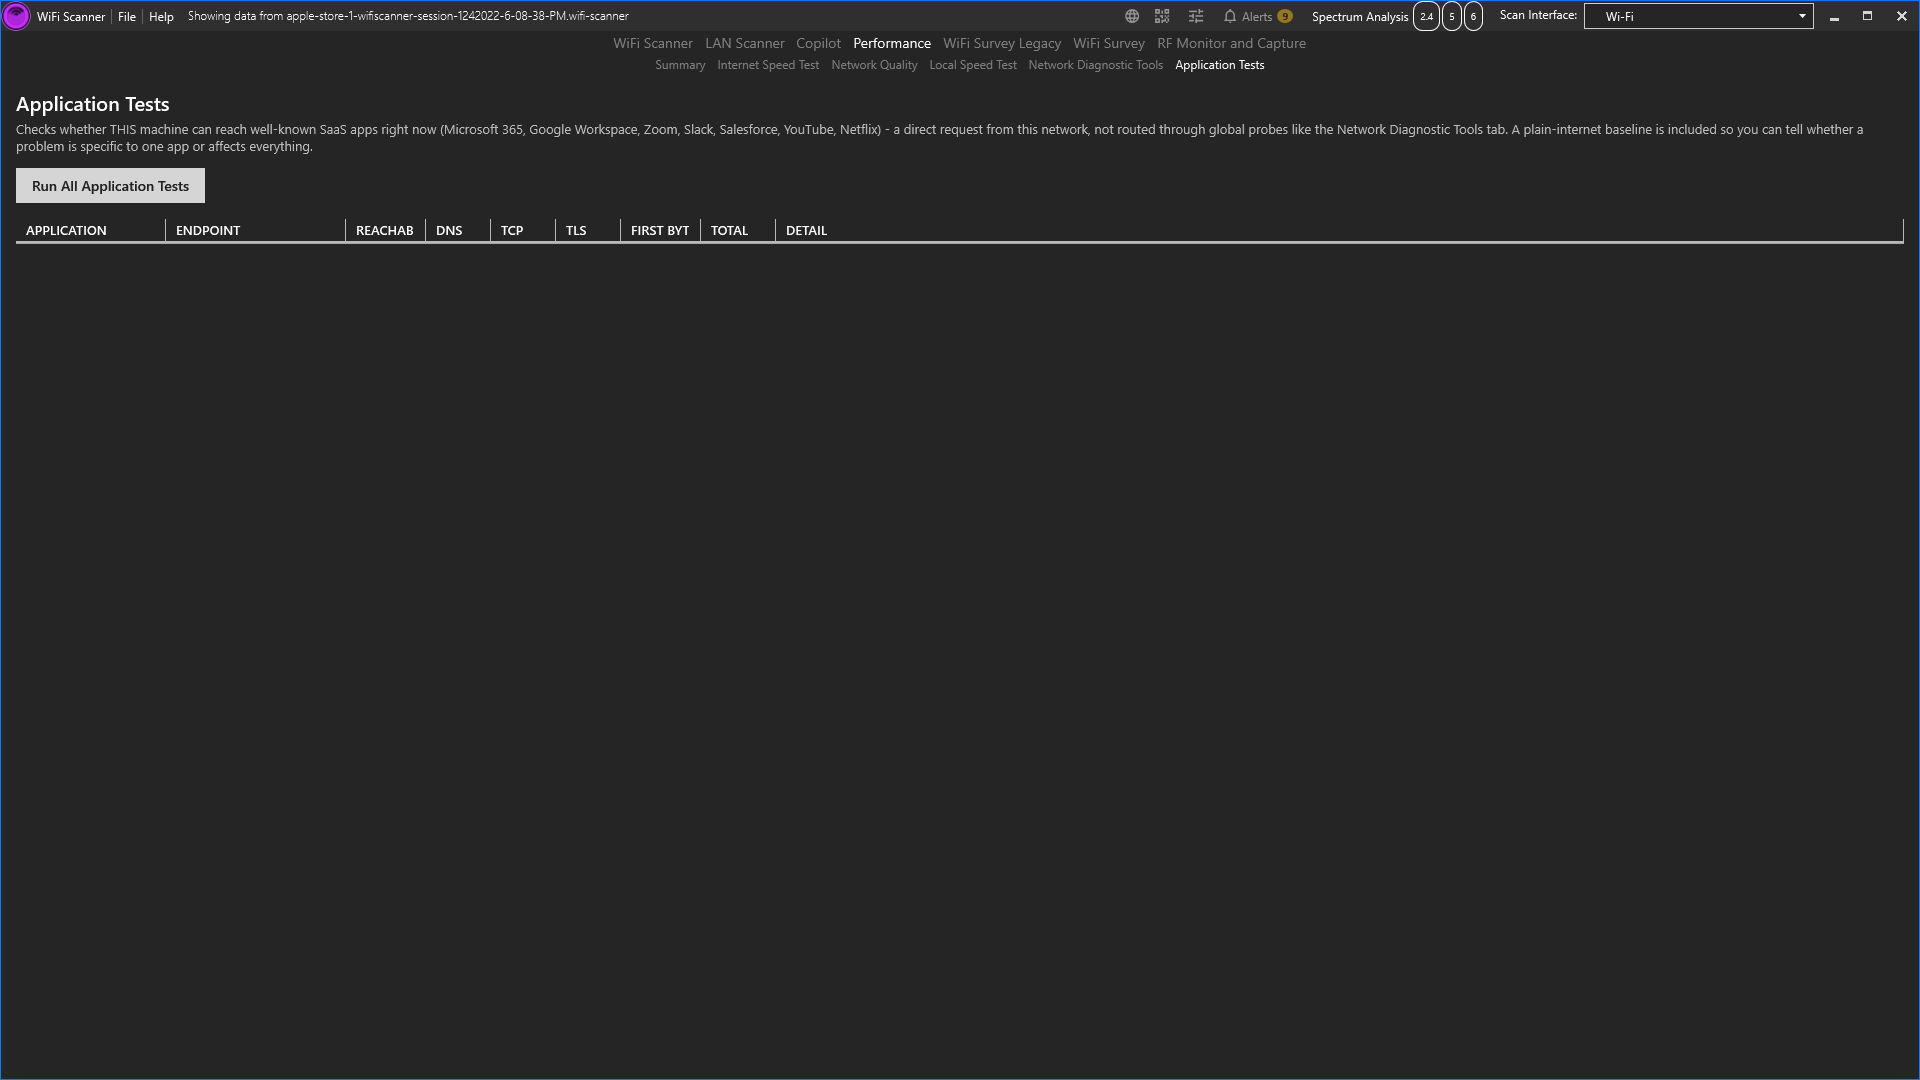
The complementary check to Network Tests: this one is a direct request from this machine (not routed through global probes), telling you whether the network you're on right now can actually reach 12 well-known endpoints across Microsoft 365, Google Workspace, Zoom, Slack, Salesforce, YouTube/Netflix, plus a plain-internet Cloudflare baseline. Each row breaks down DNS/TCP/TLS/first-byte timing separately, so you can see exactly where a broken connection to a specific app is failing: DNS resolution, the TCP handshake, TLS negotiation, or just a slow server response.
LAN Scanner
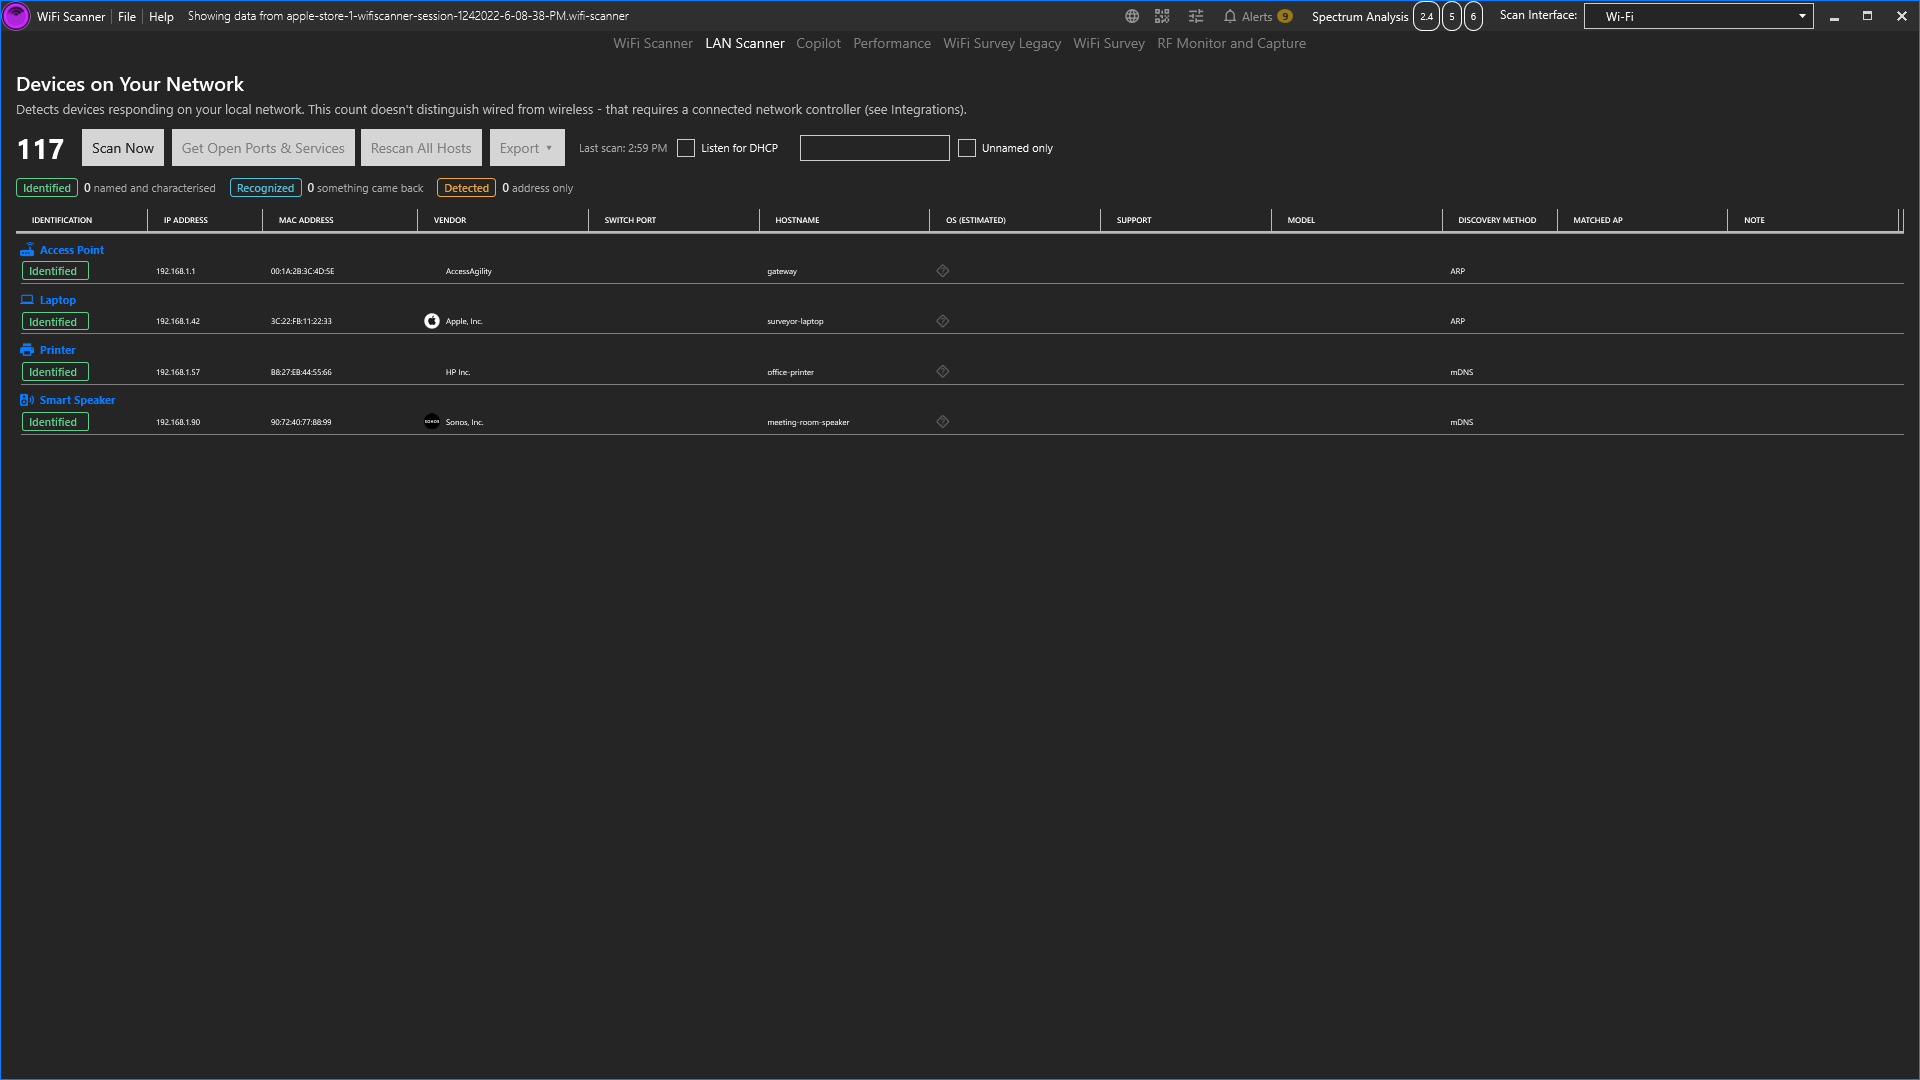
LAN Scanner is its own top-level tab, alongside WiFi Scanner, Copilot, Performance and WiFi Survey. WiFi Scanner scans the air; LAN Scanner scans the wire.
A grouped, persistent inventory of every device seen on the local subnet, not just APs/routers, but phones, laptops, printers, smart-home gear, NAS boxes, game consoles, and anything else with an IP. Results stream into the grid live as the scan finds each device, grouped by guessed device type, and persist across app restarts (each device upserts by MAC address rather than starting from empty every scan). Nothing runs until you ask: click Scan Now to sweep the subnet, then Get Open Ports & Services to probe what was found. Run Full Diagnostic on the Connection Summary tab no longer sweeps the network on its way through, so a diagnostic finishes in seconds rather than waiting on a scan you did not start.
Click any row once to open the details panel alongside the grid (no separate popup window): vendor (with a real favicon-style icon once it's looked up), hostname, matched access point (if the device's MAC correlates to a BSSID this app has also seen as a wireless AP), first/last seen, an editable note, and a live open-port scan of common services.
- mDNS / Bonjour: a brief DNS-SD sweep alongside the scan, picking up the same self-announced name your phone, TV, or printer broadcasts to apps like Bonjour Browser (e.g. "Living Room TV" instead of a generic router-assigned name). When both mDNS and reverse-DNS resolve a name for the same device, the mDNS name is used, since it's usually more readable.
- NetBIOS fallback: when a device has no reverse-DNS entry at all (common for older Windows machines and many IoT/embedded devices on a typical home network), a NetBIOS name query is tried before giving up on a name for that device.
- OS guess from ping TTL: the device details panel's "OS (estimated)" line is a coarse guess (Windows / Linux & macOS & Android & embedded / Network device) read off the TTL of the same ping already used to detect the device (no extra probing, and intentionally rough rather than a precise fingerprint).
WiFi Survey → Projects Panel
The left panel manages survey projects, each one tied to a floor plan image.
- "+" (Create new Survey Project): opens the project setup dialog.
- Folder icon (Import a Survey Project): loads a project file someone else exported or emailed you.
- Each row's ⋮ menu: Edit, Save As (branch/duplicate), Export, Clear (wipe data, keep the shell), Delete.
Below the project list, once a project is open: Project Settings (the Active / Speed Test / Passive / Access Points checkboxes that show/hide each marker type on the floor plan to declutter comparisons, plus Continue From Last Path) sits at the top, followed by the Survey Paths/heatmap-type list, then whichever mode-specific form is currently active. Calibration, AP-on-a-Stick placement, the WiFi marker form, or the heatmap color-range picker all dock here directly instead of opening as a separate window, so they never cover the floor plan underneath. Below that, Scanned Networks appears during a Passive survey for picking a filter network from the live scan.
WiFi Survey → Toolbar
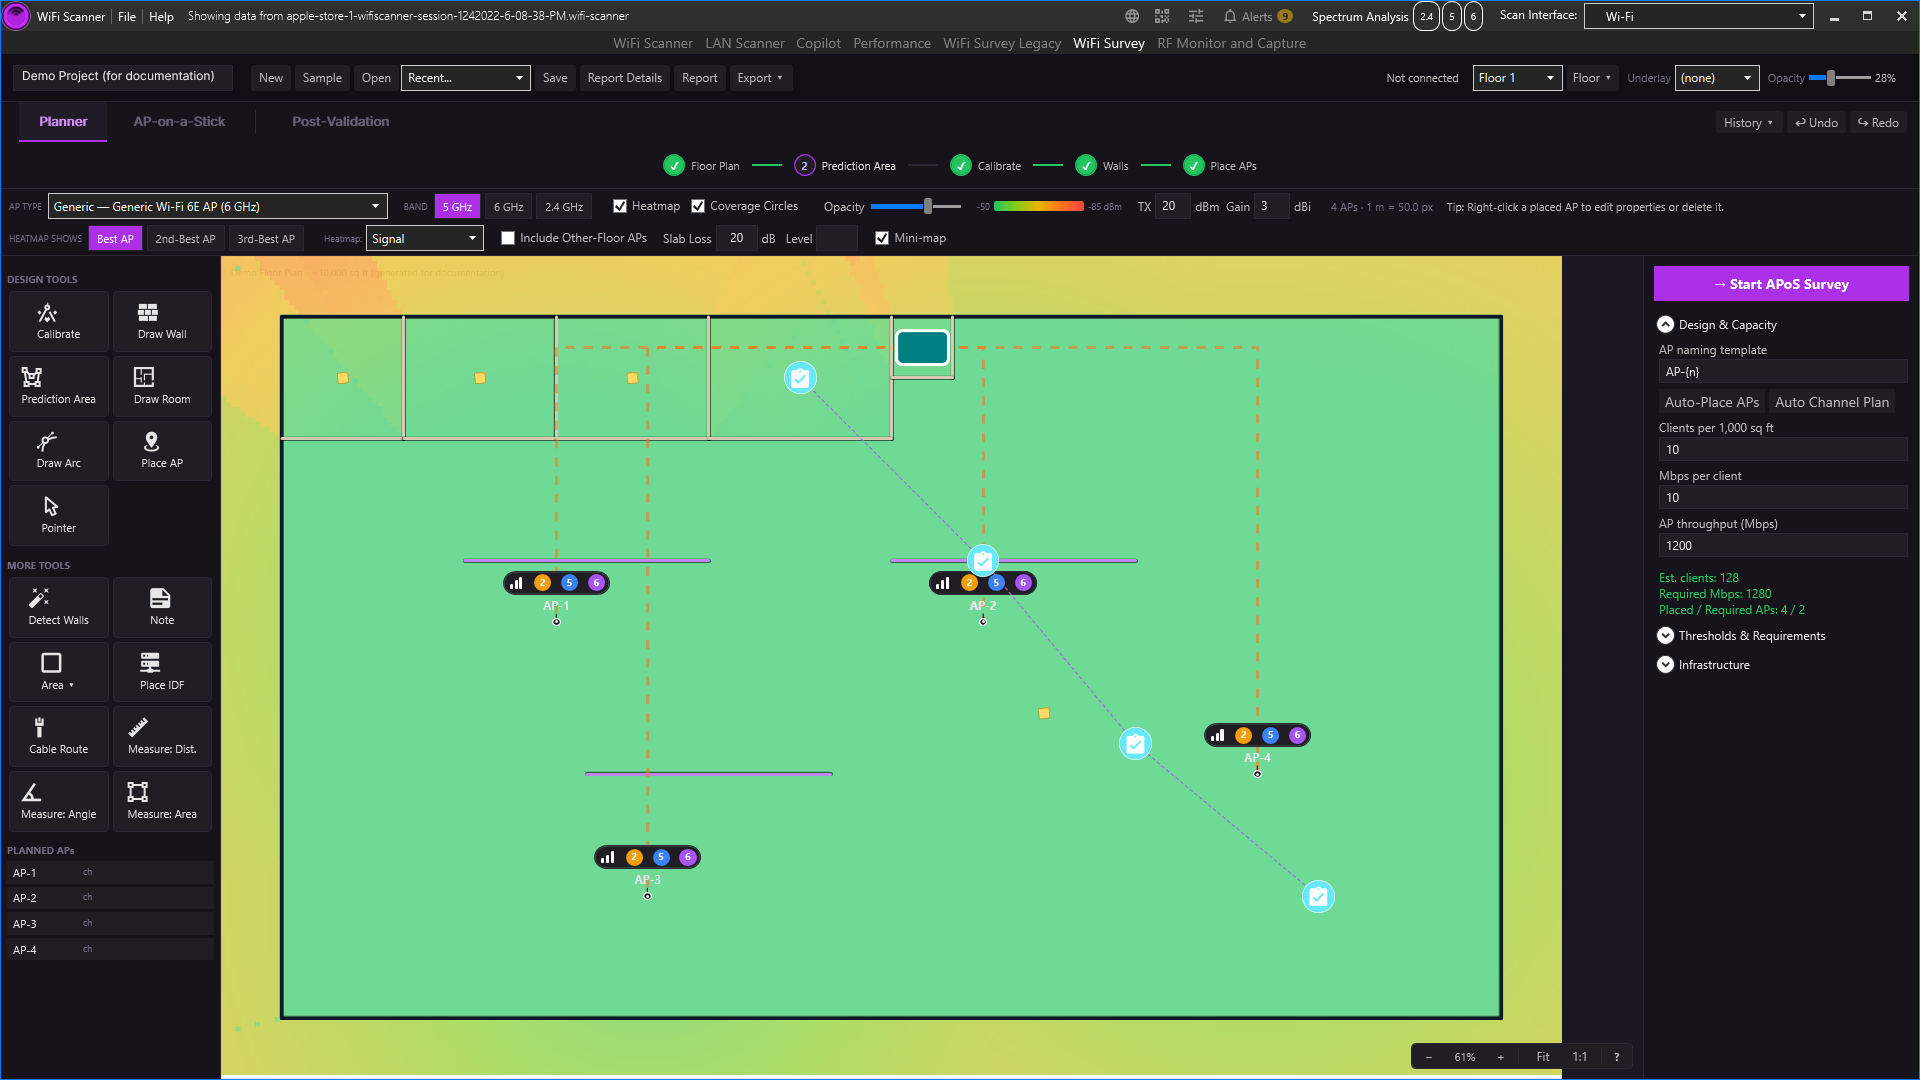
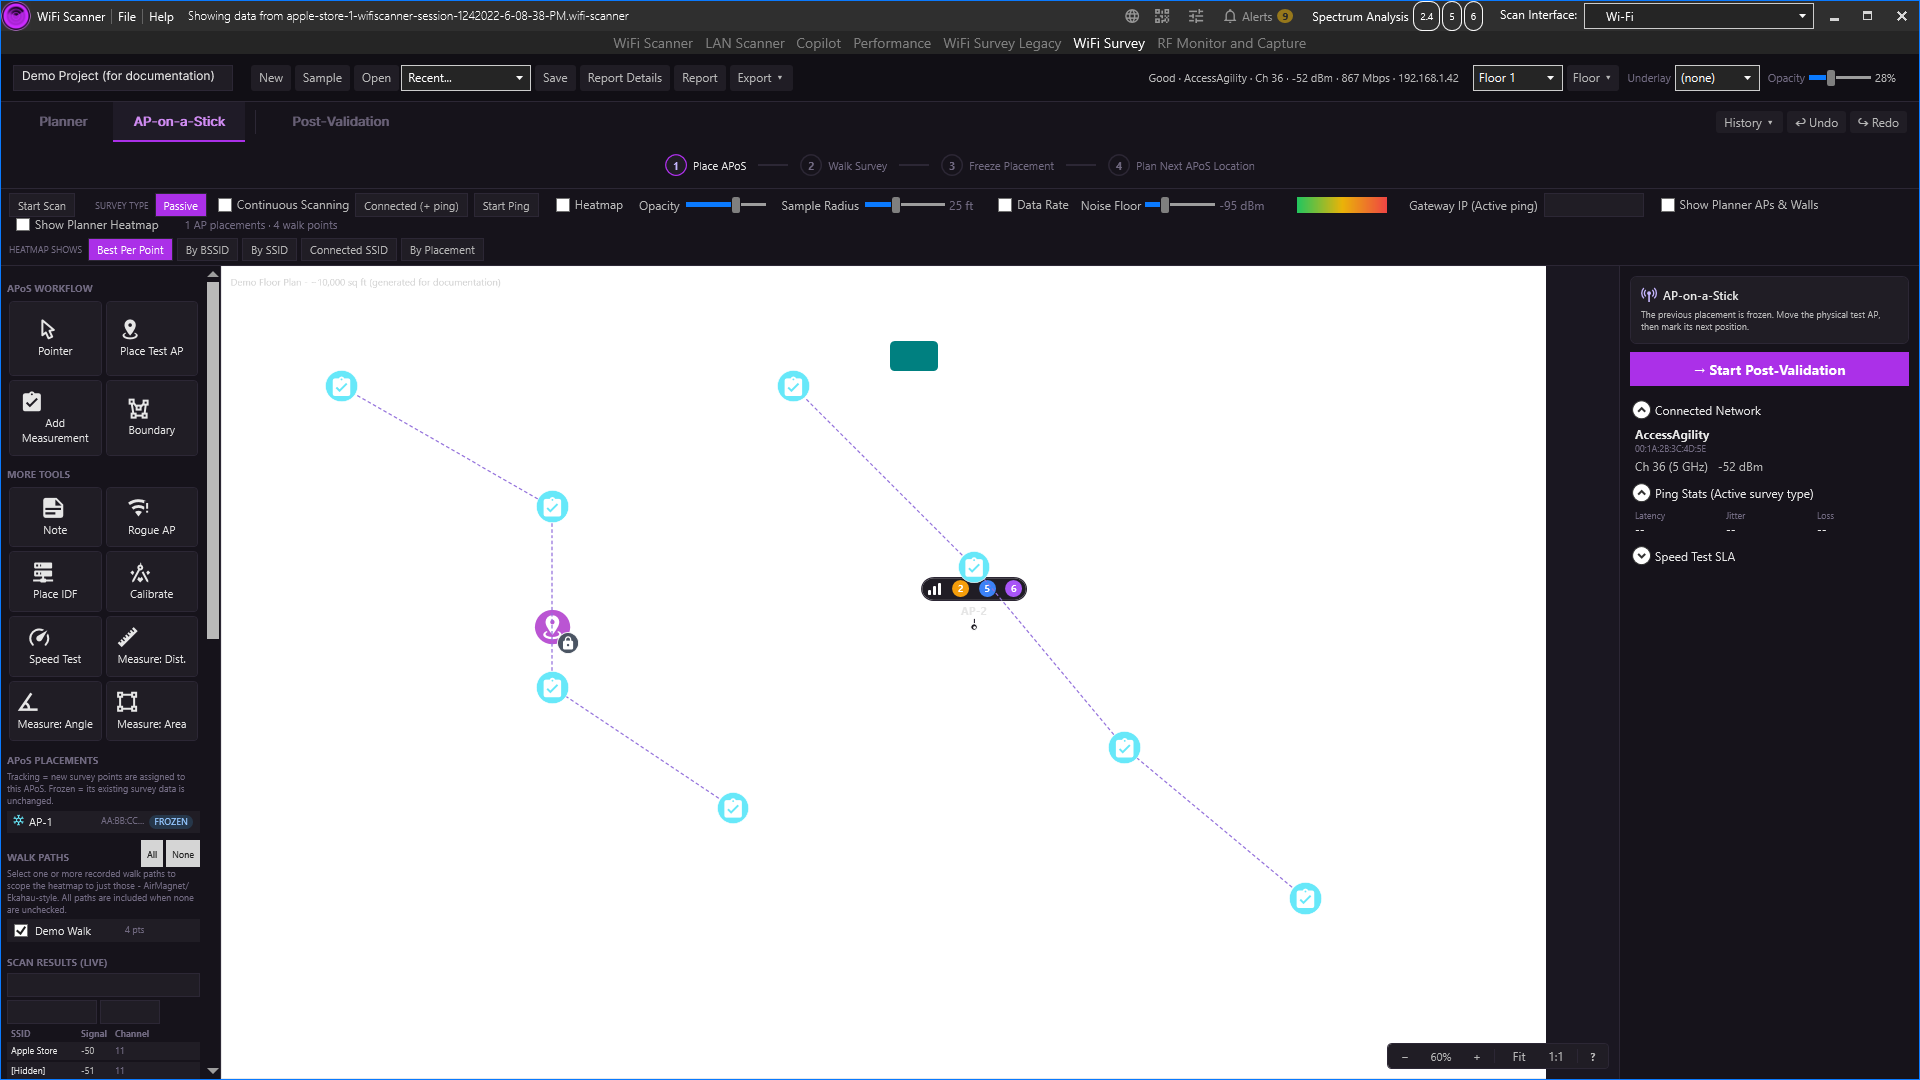
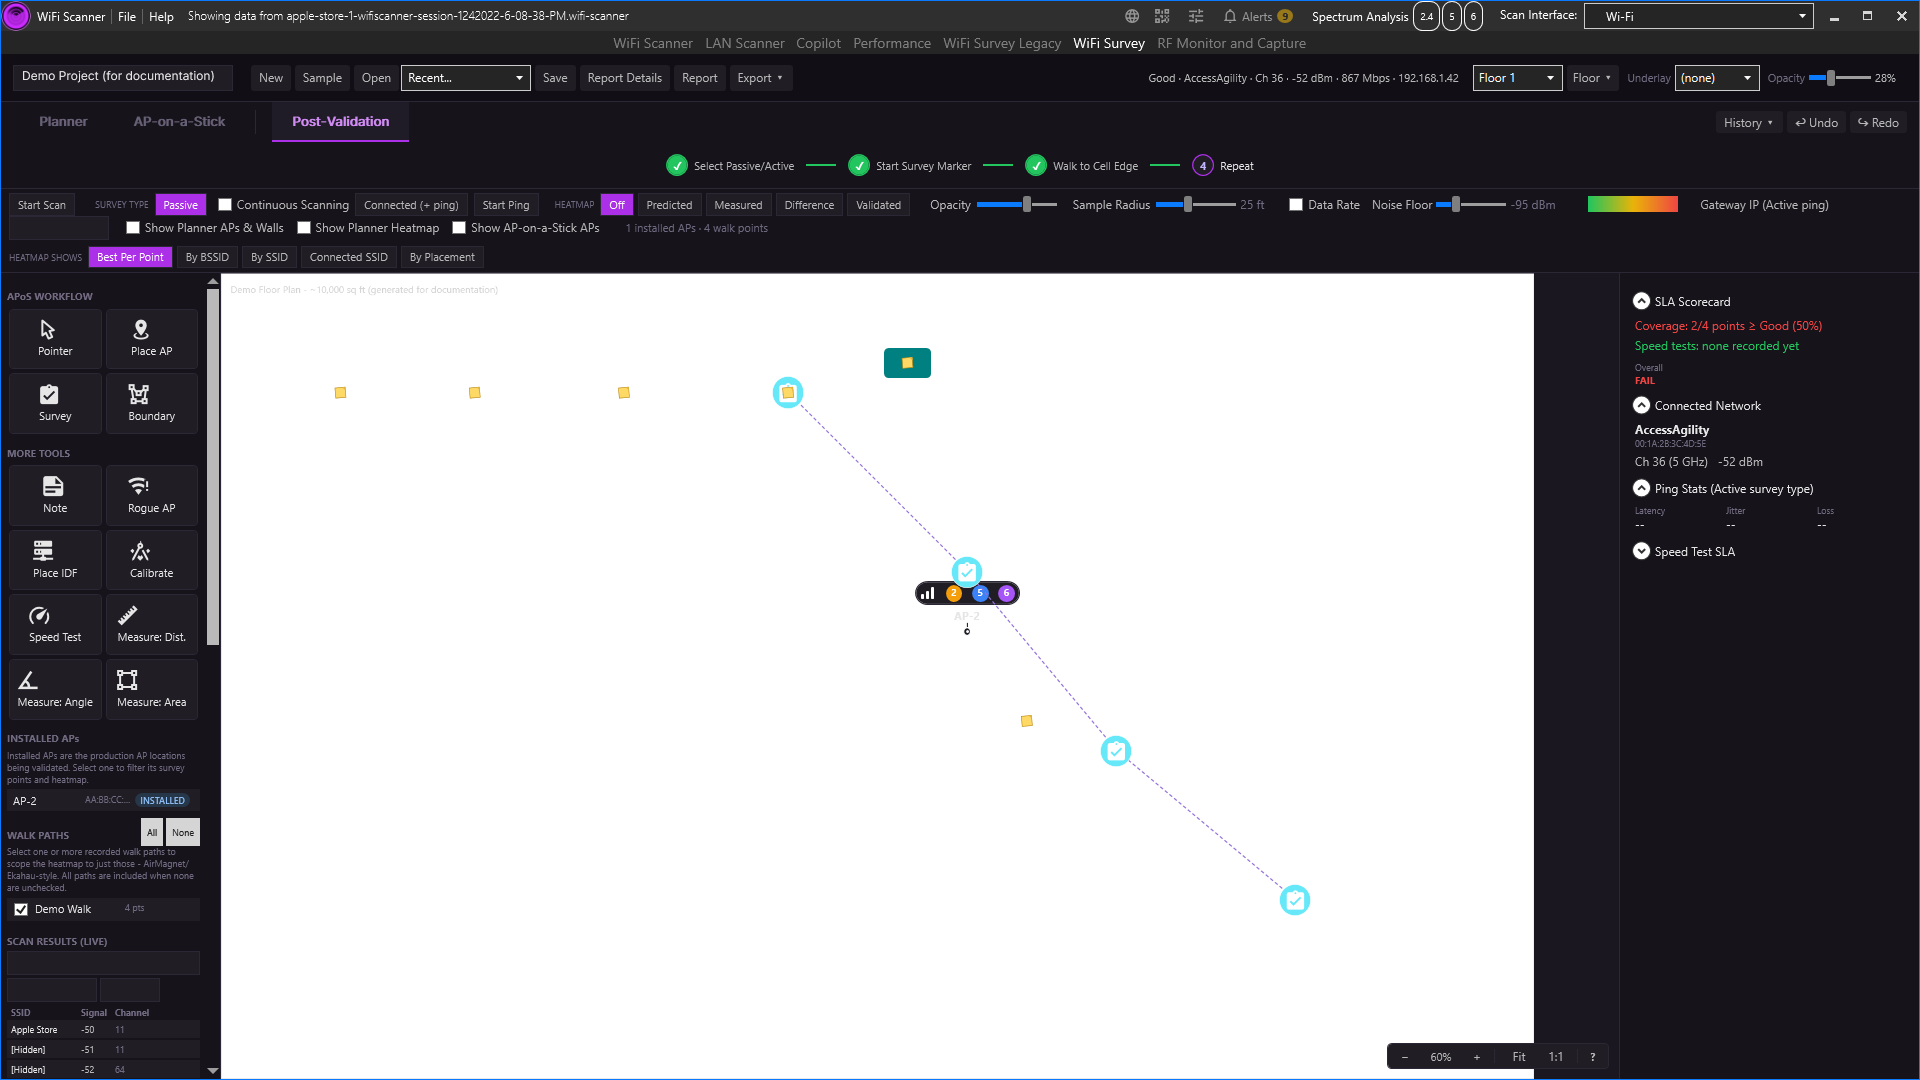
Three mode tabs (Planner, AP-on-a-Stick, Post-Validation) sit just under the project bar; each has its own left-side tool rail, and only one mode/tool is active at a time. The default Pointer tool also drags any selected marker/AP/wall directly on the canvas (a small 4px threshold tells a real drag from a plain click). There's no separate "Move" tool to switch to first.
Planner tools
| Tool | What it's for |
|---|---|
| Pointer | Select, drag-to-move, and, with a rectangular marquee drag on empty canvas, multi-select. Delete removes whatever's selected; Esc deselects or cancels an in-progress draw. |
| Place AP | Drops a planned access point for predictive coverage modeling. |
| Draw Wall / Draw Room / Draw Arc | Traces the building's real wall geometry. Draw Wall is a continuous run: click each corner and the wall keeps going, staying joined as you follow the plan around; right-click, Esc or Enter ends the run, and the next click starts a fresh one. Selecting any of these opens a Wall Material row (Drywall/Bookshelf/Glass/Wood/Marble/Brick/Concrete/Elevator/Exterior, each with its own dB loss) that stays hidden the rest of the time, keeping the toolbar itself uncluttered. |
| Detect Walls (AI) | Automatically traces wall geometry from the floor plan image instead of drawing every segment by hand. |
| Note | Drops a free-text annotation pin on the floor plan. |
| Walk Path | Sketches a planned walk route for reference before a real survey. |
| Area ▾ | One dropdown covering all three zone types: Attenuation Zone (one-time signal loss when crossed), Hole / Cutout (a full block: an atrium, an exterior gap), and Scope Zone (marks an area as in/out of scope without affecting the RF math). |
| Rogue AP | Marks a known unauthorized AP's physical location on the plan. |
| Place IDF / Cable Route | Documents a wiring closet location and the cable path from it to placed APs, for the install/cabling side of a project, not just RF. |
| Calibrate | Do this first: click two points a known real-world distance apart so all the distance math (heatmap cell size, interpolation, Measure tool) is physically accurate. Heatmap/report generation is blocked until this is set. |
| Measure: Dist. / Angle / Area | Click points to measure real-world distance, the angle between two segments, or enclosed area. Reads off the same physical scale set up in Calibrate. |
AP-on-a-Stick & Post-Validation tools
These two modes share a similar rail: Boundary (clips where heatmaps plot and where markers are allowed; its dashed outline and corner flags appear only while the Boundary tool itself is selected, so they stay out of the way of every other tool), Survey (the main walk mode; each click drops a point and captures signal data at your real-world position), Place AP, Note, Rogue AP, Place IDF, Calibrate, Speed Test (drops a marker and runs a real download/upload/latency test at that exact physical point), and the three Measure tools. AP-on-a-Stick additionally tracks separate, named placements: walk one physical test AP to several candidate mounting locations, and each placement's readings stay separate instead of blending together under one BSSID, so candidate spots compare side by side.
Active vs. Passive survey: Active mode records only your currently-connected AP's RSSI at each point. This measures real end-user experience. Passive mode captures every visible network at each point: a full RF survey, better for interference/rogue-AP hunting across the whole space.
What a passive click does: it takes a fresh scan at that exact spot rather than reusing whatever the last scan tick left behind, which takes a few seconds. A ring appears on the point straight away and fills as the scan runs, so you can see the click registered and how much of the wait is left; the marker replaces it when the reading lands. Clicking again while that ring is still filling does nothing; wait for it to finish. Passive capture needs a live scan running: if it is not, the app says so rather than recording a stale reading.
Reading a point back: with the Select tool, click any walk point to open every network that was heard there: SSID, BSSID, channel and signal, strongest first, with that point's own strongest reading highlighted. This is the whole passive snapshot, not just the headline network, so you can answer "how strong was the other SSID right here?" long after the walk. Active points record only the connected network, so they show that one instead of a list.
WiFi Survey → Header: Floor ▾ / Share / Underlay
The top project bar (visible in the Planner screenshot above) went through a round of consolidation this release to keep it from sprawling as features were added.
- Floor 1 ▾ (the floor-name dropdown) switches which floor you're viewing.
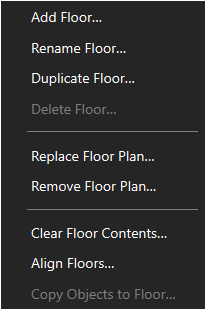
- Floor ▾ is a separate consolidated menu: Add Floor, Duplicate Floor, Delete Floor, Clear Floor (wipes this floor's markers/walls/zones but keeps the floor itself and its plan image), Align Floors… (click 2 matching landmarks per floor, enough to correct rotation between floors, not just scale/position; required before Underlay or multi-floor CCI mean anything; a live "Aligned / Not aligned" badge next to Underlay confirms it worked), Import Floor Plan (including pulling one directly from Meraki, see Projects Panel), and Copy to Floor.
- Underlay shows another floor's plan faintly beneath the current one as a visual reference. Pick it from the dropdown next to the label; requires the two floors to already be aligned (Floor ▾ → Align Floors…), otherwise it's a no-op.
- Share opens the real-time collaboration panel: invite someone else to view or
co-edit the same project live; the button's own label updates in place to show who's connected
(e.g.
Share (2)) once a session is active. Temporarily unavailable while a sync bug is being fixed; not included in the trial or the Pro license for this release. - Export ▾ covers PNG Screenshot, Cable BOM (CSV), and Walk Data (CSV), alongside the report formats. See Report below.
- History ▾ / Undo / Redo sit on the mode-tab row (next to Planner/AP-on-a-Stick/ Post-Validation) rather than the project bar.
WiFi Survey → Heatmaps & Visualization
A Heatmap: dropdown picks the visualization mode: Signal, SNR, AP Overlap, CCI (co-channel interference, weighted so an interferer on the serving AP's primary channel scores higher than one only reachable via a secondary/bonded channel), and Roaming (colors the 2nd-best-AP grid against a roam threshold). Only one mode renders at a time, same canvas.
HEATMAP SHOWS: Best AP / 2nd-Best AP / 3rd-Best AP: plotting the 2nd or 3rd-strongest heard signal instead of just the strongest is how you judge roaming and redundancy: is there always a real fail-over AP, not just the primary? Include Other-Floor APs folds in APs from an aligned floor above/below, weakened by that floor's own Slab Loss (dB). It requires Align Floors first.
The vertical RSSI slider next to the canvas recolors the heatmap live as you drag either handle, with no regeneration needed. Opacity is set right on this panel (no separate dialog); the color gradient itself offers a standard green-to-red scheme plus a colorblind-safe blue-to-orange alternative (Settings → Accessibility → Color vision).
WiFi Survey → Report (PDF / Word Template)
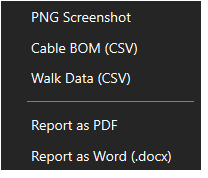
Report as PDF is the fast, fixed-layout option: one click, no template needed. Report as Word (.docx) is the fully customizable path: you control what's in the report and how it's arranged, using Word itself instead of a form inside the app.
A survey project can have a Word Report Template attached, an ordinary .docx file
containing tag placeholders like {{ApSummaryTable}} or {{HeatmapImage:5:Best}}.
Attach one when creating or editing a project: either upload your own .docx, or click
Create starter template... to generate one pre-populated with every available tag,
grouped under Text / Images / Tables headings. Open that in Word, delete what you don't want, reorder
and format the rest exactly as you'd like the final report to read, and save it back as your template.
Clicking Export ▾ → Report as Word (.docx) copies your template, replaces every tag with real data from the current survey (company/project name, calibration, floor plan and heatmap images, the AP summary/AP placement/WiFi marker notes/speed test tables), and prompts you for where to save the finished .docx. Your original template file is never modified, so it's reusable across projects and future reports.
| Tag | What it inserts |
|---|---|
{{CompanyName}} / {{ProjectName}} / {{Ssid}} / {{GeneratedDate}} | Text: company/project name, SSID, and generation date. |
{{Calibration}} | Text: the real-world distance calibration value. |
{{FloorPlanImage}} | Image: a capture of the floor plan as currently drawn. |
{{HeatmapImage:Band:Rank}} | Image: e.g. {{HeatmapImage:2.4:Best}}; any of the 9 band (2.4/5/6) × rank (Best/2nd/3rd) combinations that have data. |
{{ApSummaryTable}} / {{ApPlacementTable}} | Table: discovered APs, and physically-placed APs with name/serial/notes. |
{{WifiMarkerNotesTable}} / {{SpeedTestResultsTable}} | Table: notes left on WiFi survey markers, and speed test results captured during the walk. |
Requires calibration to already be set, same as heatmap generation. Company name/logo/color for the tags that use it are set once in Settings → Alerts & Reports → Report Branding.
RFMON Tab
Locks a configured SSH sensor onto one channel instead of hopping the whole band, trading
BSSID-only coverage for the chance to see which clients are actually associated to which access
points. Requires the RF Monitor add-on and a sensor: a Raspberry Pi or WLAN Pi running
iw, ip and tcpdump with passwordless sudo for those three
binaries specifically.
Sensors are configured in Settings → Remote WiFi Scanner; this tab only selects among the ones already configured.
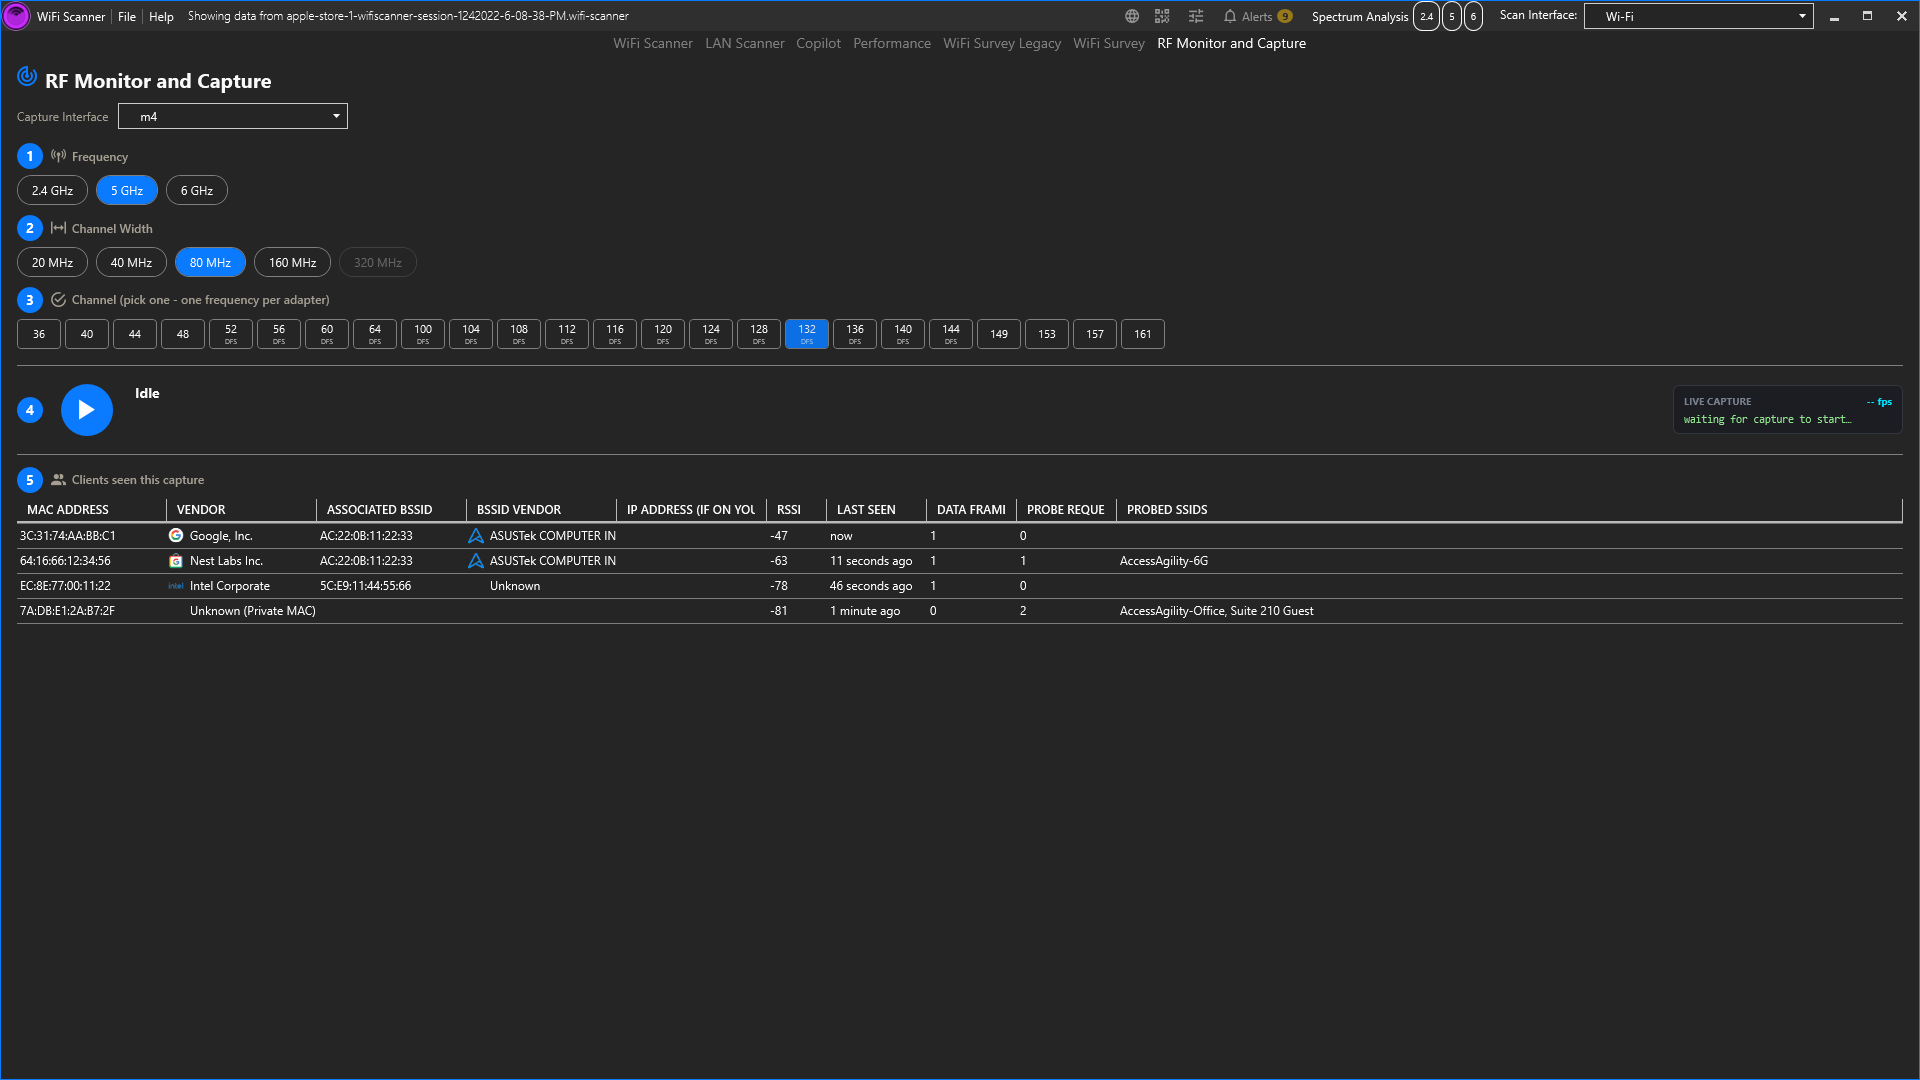
Setting up a capture
- Capture Interface: which configured sensor to capture with.
- Frequency: 2.4, 5 or 6 GHz.
- Channel Width: 20/40/80/160 MHz, and 320 MHz on 6 GHz. Widths the adapter does not advertise are disabled rather than offered and left to fail.
- Channel: the grid narrows as the width widens, offering only channels that are legal primaries at that width (channel 165, for instance, has no bonding partner and disappears above 20 MHz). DFS marks 5 GHz channels requiring radar detection, PSC marks 6 GHz Preferred Scanning Channels, and REC marks the non-overlapping 2.4 GHz channels (1, 6, 11).
Press the capture button to start. The status area reports frames captured and confirms the lock against the radio itself, including the width actually applied, so a driver quietly narrowing an 80 MHz request to 20 MHz is visible rather than silent.
Clients seen this capture
A table of every client seen on the locked channel: MAC address and vendor, the BSSID it is associated to and that AP's vendor, its IP address if it is on your own LAN, RSSI, when it was last seen, data-frame and probe-request counts, and any SSIDs it probed for. Clients shown as Unknown (Private MAC) with no associated BSSID are normal: modern phones randomise the MAC they probe with, which defeats vendor lookup by design.
The same data also populates the Scanner tab's Clients sub-tab, filtered to whichever AP is selected there.
Settings → General
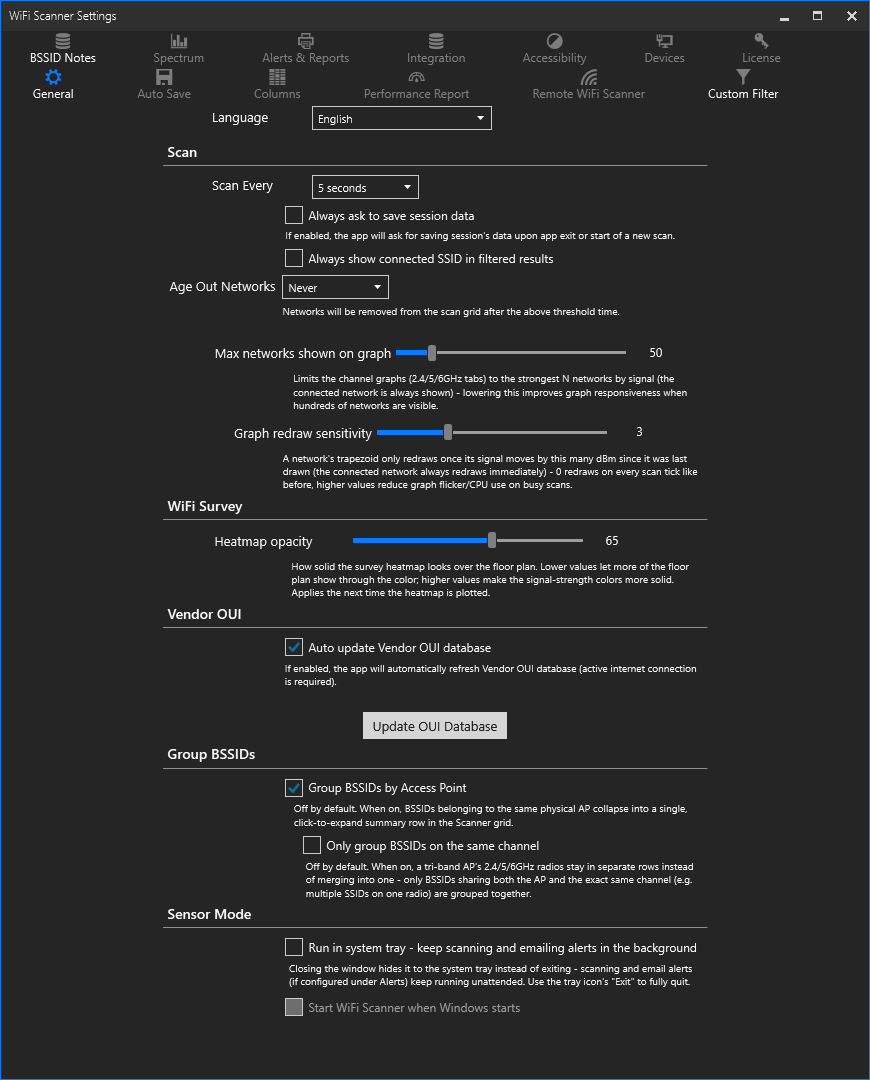
| Setting | What it changes |
|---|---|
| Scan Every | How often the WiFi adapter is re-polled (5 to 60 seconds). Faster is fresher data at the cost of more CPU/adapter churn. |
| Always ask to save session data | Whether you're prompted to save before exiting or starting a new scan. |
| Age Out Networks | How long an unseen AP stays in the grid before being dropped (1 min to 24 hr, or Never). |
| Always show connected SSID in filtered results | Guarantees your own connection stays visible even if an active filter would otherwise hide it. |
| Max networks shown on graph | Caps the channel graphs and Signal vs. Time to the strongest N APs by signal (connected AP always shown). Keeps graphs responsive with hundreds of networks visible. |
| Graph redraw sensitivity | Only redraws a network's shape once its signal moves by this many dBm. Higher values reduce flicker/CPU on busy scans. |
| Always show Spectrum Analysis controls | Skips the default auto-hide behavior (controls normally only appear once supported hardware is detected). |
| Heatmap opacity | How solidly WiFi Survey's coverage color covers the floor plan underneath (10 to 100%). |
| Auto update Vendor OUI database / Update OUI Database | Keeps AP vendor identification current. With the checkbox on, the app checks for a fresher vendor database roughly once a week, a few seconds after launch (never blocking startup). The bundled offline copy already covers vendor lookups from first launch with no network dependency. The manual refresh button bypasses the weekly gate but is itself debounced to once an hour. |
| Run in system tray (Sensor Mode) | Closing the window hides to tray instead of exiting. Scanning and email alerts keep running unattended. |
| Start WiFi Scanner when Windows starts | Only usable with Sensor Mode on, and makes unattended monitoring survive a reboot. |
Settings → Columns
34 checkboxes covering every WiFi column plus the 8 Speed Test columns, organized the same way as the grid's own right-click header menu, just a more comfortable place to set up your default view once, rather than clicking through headers.
Settings → Custom Filter
Manage saved filters here instead of one at a time from the Scanner tab's Save Filter dialog: enter a Name and Filter Text and click Save, or edit/delete existing ones from the list. Import/ Export Filters move a whole filter library in or out as CSV, handy for sharing a standardized set of filters across a team or multiple machines.
Settings → BSSID Notes
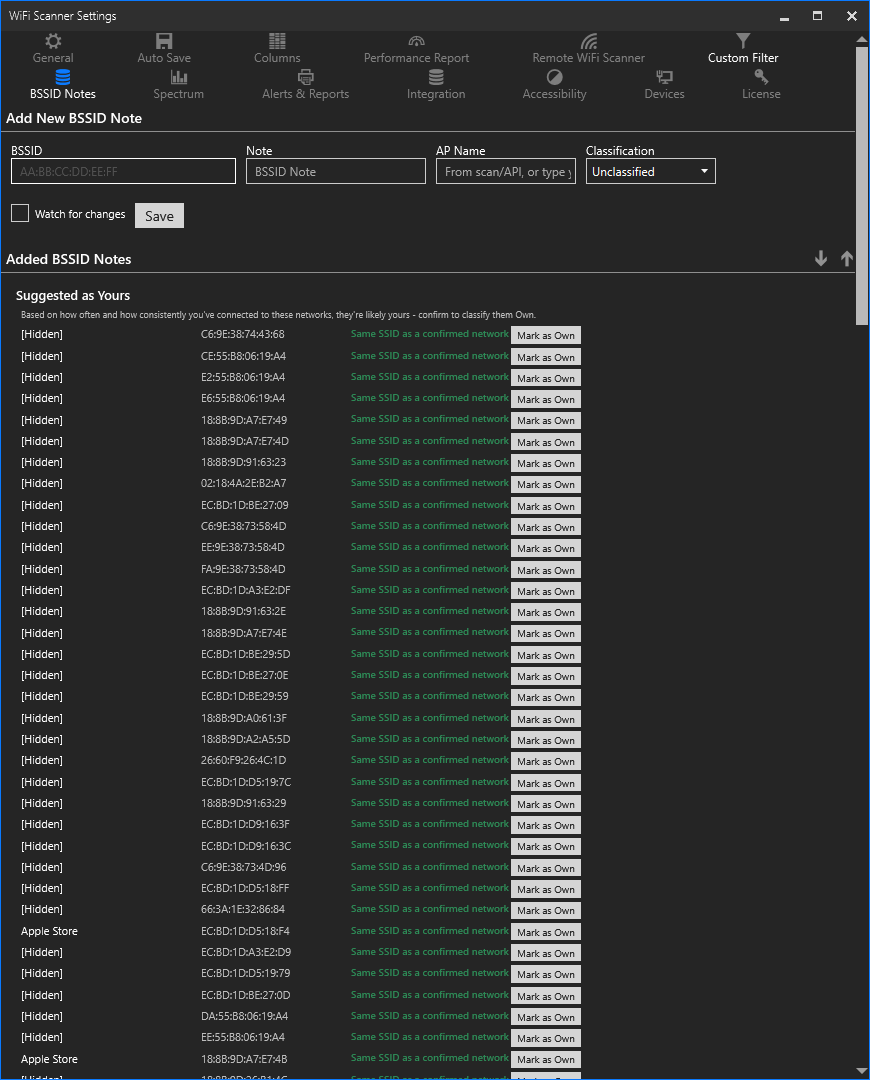
Annotate and classify individual access points: enter a BSSID, an optional free-text note, and a Classification: Unclassified, Own, Neighboring, Rogue, or Interfering. This never hides or suppresses a detection (a Rogue AP's security posture is still real diagnostic signal in Copilot); it only scopes things like email alerts to your own equipment (see Alerts & Reports) and feeds the PCI Compliance / Network Health reports and the grid's Classification column.
A "Suggested as Yours" section appears automatically, using your connection history to guess which APs you likely own. Click Mark as Own to confirm instead of typing each one manually. Import/Export Notes works the same way as Custom Filters, as CSV.
A separate Watch for changes checkbox on each note (with its own Watched column in the grid) is unrelated to Classification. Turning it on is what actually starts monitoring that BSSID for behavioral changes and raising Alerts events. A BSSID can be watched without being classified Own (e.g. keeping an eye on a known neighboring AP), and classified Own without being watched (e.g. equipment you don't need active alerts on).
Settings → Spectrum
| Setting | Purpose |
|---|---|
| Start spectrum analysis automatically | Auto-connect/start sweeps the moment supported USB hardware is plugged in. |
| Decay | How quickly the live trace "falls" after a signal disappears, useful for spotting transient interference (microwaves, Bluetooth) vs. persistent occupants. |
| Averaging window size | Smooths the trace over time, reducing noise/jitter in the displayed signal. |
| Utilization threshold | The power level above which a frequency counts as "occupied" for channel-utilization math. |
| Display refresh rate / Max points per trace / Waterfall history depth / Density resolution | Four performance sliders: lower any of them if the Spectrum tabs feel sluggish. Density resolution is the single biggest lever (cost scales roughly with the square of the percentage). |
Settings → Alerts & Reports
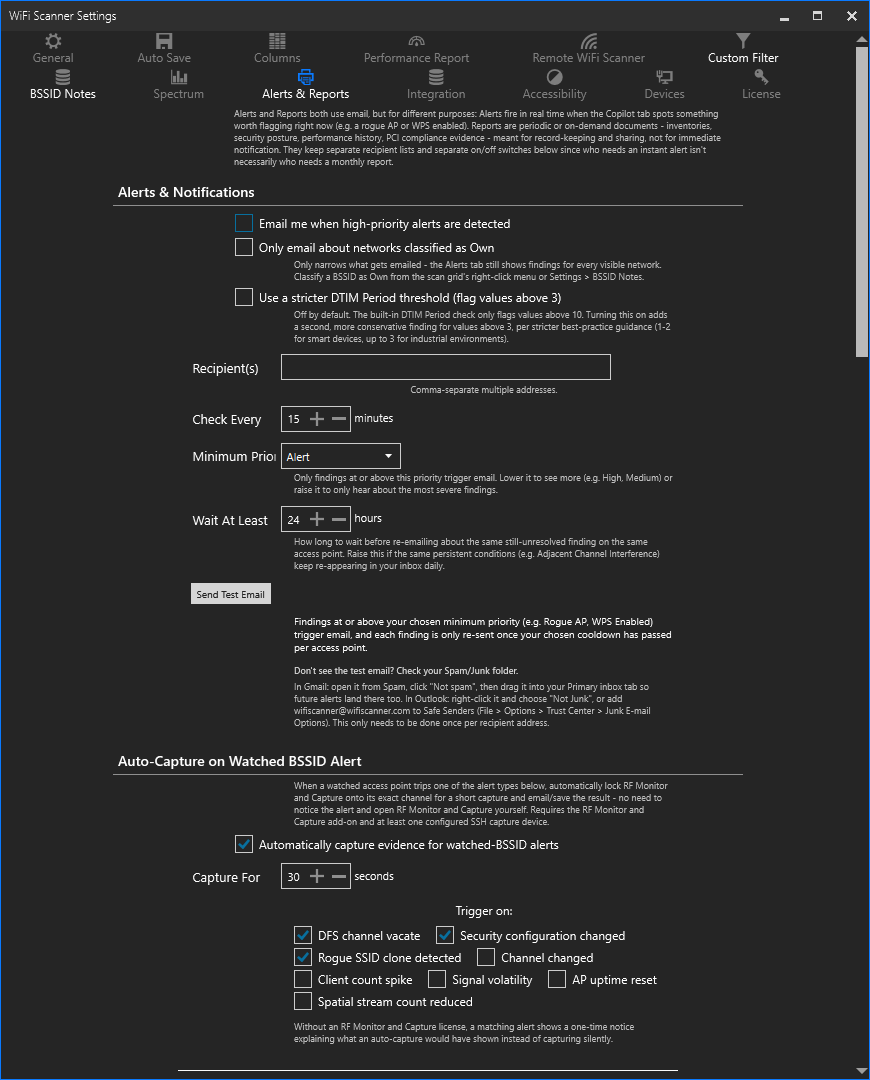
One combined tab covering two related but distinct email features. Each keeps its own recipient list and its own on/off switch, since not everyone who needs a periodic report also wants real-time alerts, or vice versa.
Alerts & Notifications
- Email me when high-priority Copilot alerts are detected: the master switch. Only Very High/Alert-priority findings (rogue AP, WPS enabled, etc.) trigger an email, and each distinct finding only re-sends once every 24 hours per AP, so you won't be flooded by the same issue repeatedly.
- Only email about networks classified as Own: narrows what gets emailed only; the Alerts tab in-app still shows findings for every visible network regardless.
- Recipient(s), Check Every N minutes, and Send Test Email (with inline guidance for pulling a test email out of Gmail/Outlook Spam) round out the setup.
The 24-hour re-send cooldown is persisted to disk, so an unresolved finding won't re-email right after an app restart mid-cooldown.
Report Branding
Set your Company Name, Logo, Primary Color, and Contact Info once. It's applied to every generated report (and alert email) afterward.
Scheduled Reports
Five report types (AP Inventory, Security, Performance, Network Health, PCI Compliance),
each independently schedulable (Nd/Nh/Nm, 5 minutes to 365
days), optionally PDF-attached, and triggerable immediately via its own Send Now
button. The PCI Compliance report additionally includes eight yes/no self-attestation
questions (network segmentation, physical AP security, centralized logging, vendor defaults changed,
and four about accounts: no shared accounts, terminated users revoked, inactive accounts disabled,
vendor accounts enabled only when needed)
for requirements a wireless scan alone can't verify, plus a CDE scope checklist of
which SSIDs count as part of the cardholder-data environment. Answer them once here and every
generated PCI report includes your answers alongside what the scan itself detected. The PCI
Compliance strong-signal threshold slider (default -40 dBm) is separate from the Security report's
own strong-signal slider below: a non-Own AP has to clear the threshold on whichever report you're
configuring.
The CDE scope checklist lets you pick from SSIDs currently visible in a live scan, or type one in manually to flag it as in-scope, useful for a network that isn't currently broadcasting or hasn't been scanned yet.
A scheduled report whose content hasn't meaningfully changed since the last send is skipped automatically (the schedule still advances, so it won't check again until the next interval). Send Now always sends regardless, since that's an explicit request.
The Security report includes three tables beyond its findings list: Rogue Access Points (every BSSID marked Rogue in BSSID Notes), Unclassified APs Sharing an Authorized SSID (a possible evil-twin pattern), and Strong Signal - Needs Investigation (any non-Own AP whose signal is stronger than a configurable threshold: a slider here, default -40 dBm, range 0 to -100 dBm, separate from the PCI Compliance report's own signal-strength slider below). The Network Health report includes two more tables: Primary/Secondary Channel Overlap (OBSS) (an AP's wide-channel extension landing on one of your own primary channels) and Basic Rates at Band Minimum (your own networks still advertising the lowest legacy rate for their band as supported).
Settings → Auto Save
Turns on periodic background saving of the running scan session so you don't lose data to a crash or an accidental close. Save Every (5/15/30/60 min, or a Custom minute value), Retention (how long old autosaves are kept before automatic cleanup), and Location (Browse to redirect where files are written, e.g. a network drive) round out the setup. View Sessions... opens a browser listing every autosave file with Open/ Delete actions, your way back into a specific past snapshot without hunting through folders manually.
Settings → Performance (Speed Test)
Controls which of the 17 possible columns show in the Speed Test results grid (same show/hide pattern as the main scan grid), plus test-execution behavior: Repeat Speed Test and wait N seconds for continuous monitoring over time, or Run Speed Test automatically when BSSID or SSID changes for hands-free testing while roaming (the two modes are mutually exclusive).
- Local Speed Test: the same Serve as a local speed-test target checkbox and Destination Host field as Performance → Local Speed Test, bound to the exact same setting rather than a separate copy. Change it in either place and the other updates immediately. With the target switched on, this section also shows the Server port (editable, 5203 by default), whether the server is actually running, every address on this machine another device could connect to, and the exact command to run over there, with a Copy button. Every address is listed rather than one, because a laptop usually has several (Wi-Fi, Ethernet, a VPN, Hyper-V), and only the one on the same network as the other machine will answer; the one carrying the default route is marked. If it says it is serving and the other machine still cannot connect, the usual cause is Windows Firewall blocking inbound TCP on that port. Serving as a target keeps working without a licence, so a spare machine can be left running as a speed-test target indefinitely.
- Network Diagnostics: a Default Target field, the same persisted value Performance → Network Tests's Target field starts with, so you can set your usual target (an internal server, a specific ISP hop) once instead of retyping it every time you open that tab.
- Application Tests: a fully editable list of every app and endpoint Performance → Application Tests checks (ships with 12 defaults: Microsoft 365, Google Workspace, Zoom, Slack, Salesforce, YouTube/Netflix, plus a Cloudflare baseline). Edit any cell directly, use the blank row at the bottom to add your own endpoint (e.g. an internal server or a SaaS app not in the default list), or Delete to remove one you don't care about. Changes apply on the very next test run, no restart needed. A Restore Defaults button next to the section header adds back any of the 12 built-in defaults that are missing from the list, without touching anything you've added or edited yourself.
Settings → Remote WiFi Scanner
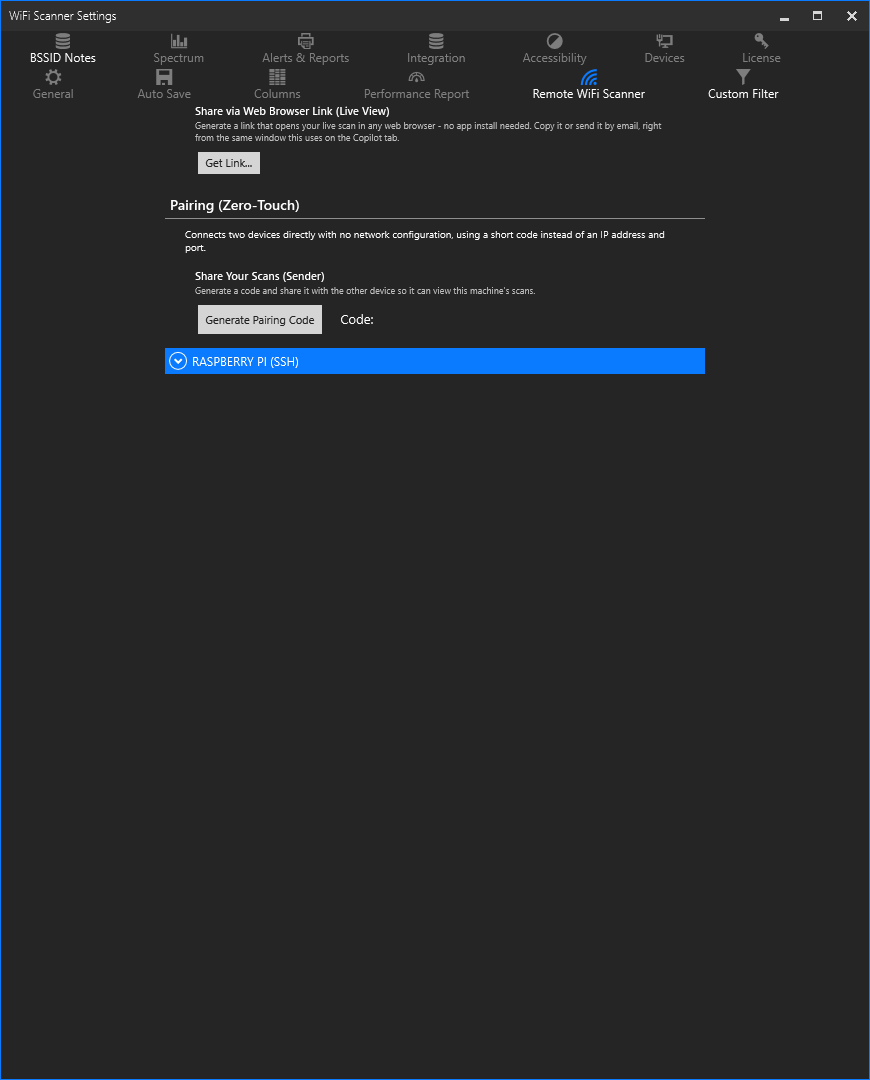
Several ways to get scan/spectrum data from a machine you're not sitting at, all on one tab. At the very top, Share via Web Browser (Live View) → Get Link... is the one-way, no-install option. Click it for a link anyone can open in a browser to watch your live Scanner grid read-only.
Pairing (Zero-Touch)
The simplest option: no network configuration at all. Two clearly labeled sections make it unambiguous which role you're setting up:
- Share Your Scans (Sender): click Generate Pairing Code and share the short code (copy-icon button) with whoever needs to view this machine's scans.
- View a Remote Scanner's Data (Receiver): enter a code generated by another device and click Connect to view its scans here. Connecting also auto-switches this machine's Scan Interface (toolbar) to Zero-Touch Remote WiFi Scanner, which is receiver-only from the toolbar; generating a code to share your own scans happens here in Settings. A Disconnect button ends an active pairing session from either section.
Behind the scenes this negotiates a direct peer-to-peer connection via a signaling relay, so it works even across separate networks/NATs with no port forwarding.
SSH Devices
For a known remote Linux machine (e.g. a Raspberry Pi or WLAN Pi) reachable by SSH: enter its host, port, username, adapter interface name, and either a password or an SSH private key, then click Test Configuration to verify it's reachable and correctly set up before saving, which catches problems (wrong adapter name, missing tools) without you having to manually SSH in and troubleshoot yourself.
The saved password and private key are encrypted at rest, matching how Integration credentials are protected. Export / Import (JSON) let you move a device list to another machine deliberately, instead of relying on a raw database copy. Credentials in an exported file are plain text. Treat the file itself like a password file.
Settings → Integration
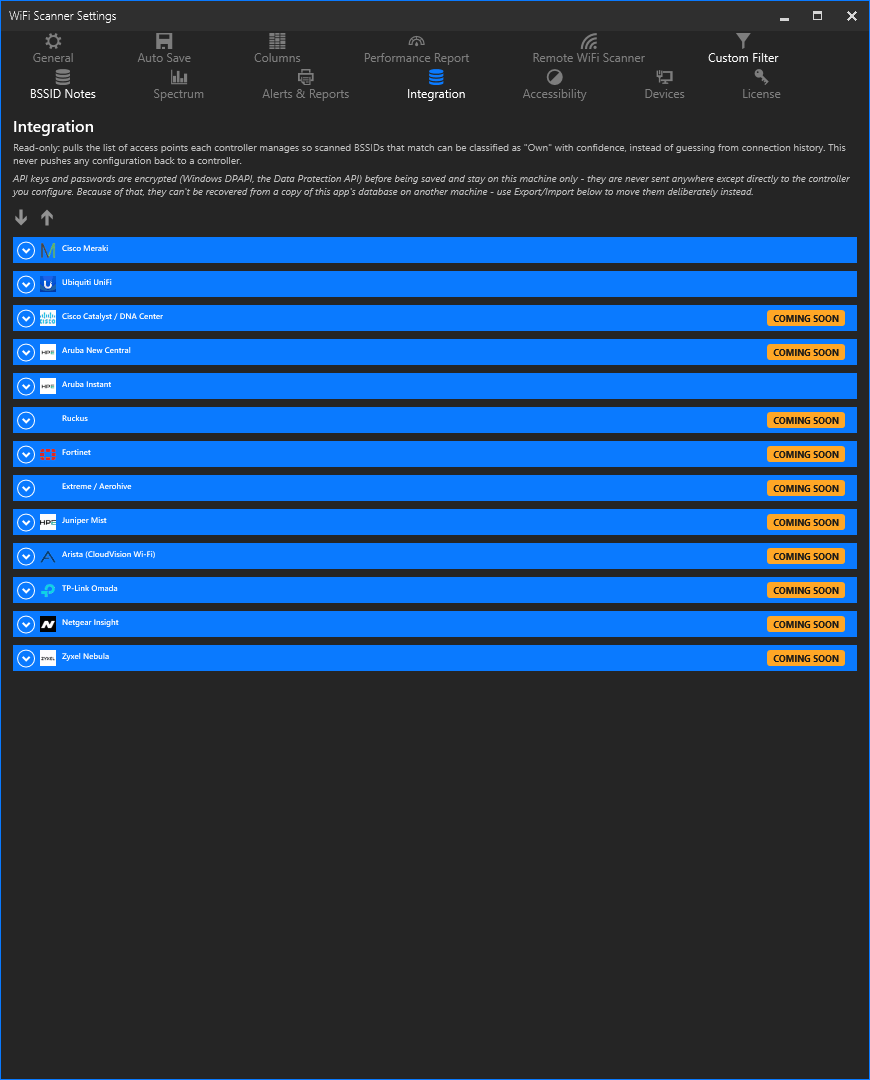
Requires an Enterprise license - not included in Pro, and not granted during the trial. The tab itself is hidden unless your license qualifies.
Connect a WLAN controller so the app knows your managed access points automatically, instead of entering every BSSID by hand in BSSID Notes. A row here per vendor:
| Vendor | Status | What's needed |
|---|---|---|
| Cisco Meraki | Implemented | An API Key only - enter it, then click Fetch Organizations to pick the Org/Site from a list rather than having to already know its ID. |
| Ubiquiti UniFi | Implemented | Controller URL, plus either an API Key (modern UniFi OS) or a Username/Password (session login for older/self-hosted controllers). Turn off Verify SSL for a self-hosted controller on a self-signed certificate. |
| Cisco Catalyst Center, Aruba Central, Ruckus, Fortinet, Extreme AeroHive, Juniper Mist, Arista, TP-Link Omada, Netgear Insight, Zyxel Nebula | Coming Soon | n/a |
Once configured, Sync Now pulls the controller's full managed-AP list and auto-classifies every matching BSSID as Own in BSSID Notes. A sync status indicator shows when the last sync ran and whether it succeeded.
The API Key and Password fields are treated as sensitive at rest: API Key shows only its last 4 characters (full value while you're actively editing it), and Password is fully masked. Both are encrypted before being written to disk, tied to this Windows user account.
Export / Import (CSV) let you move a whole set of controller configurations to another machine deliberately, without relying on a raw database copy, useful when standing up a new install rather than upgrading in place. Credentials in an exported file are plain text (the point is a deliberate, explicit transfer), so treat the exported CSV itself like a password file.
Settings → Accessibility
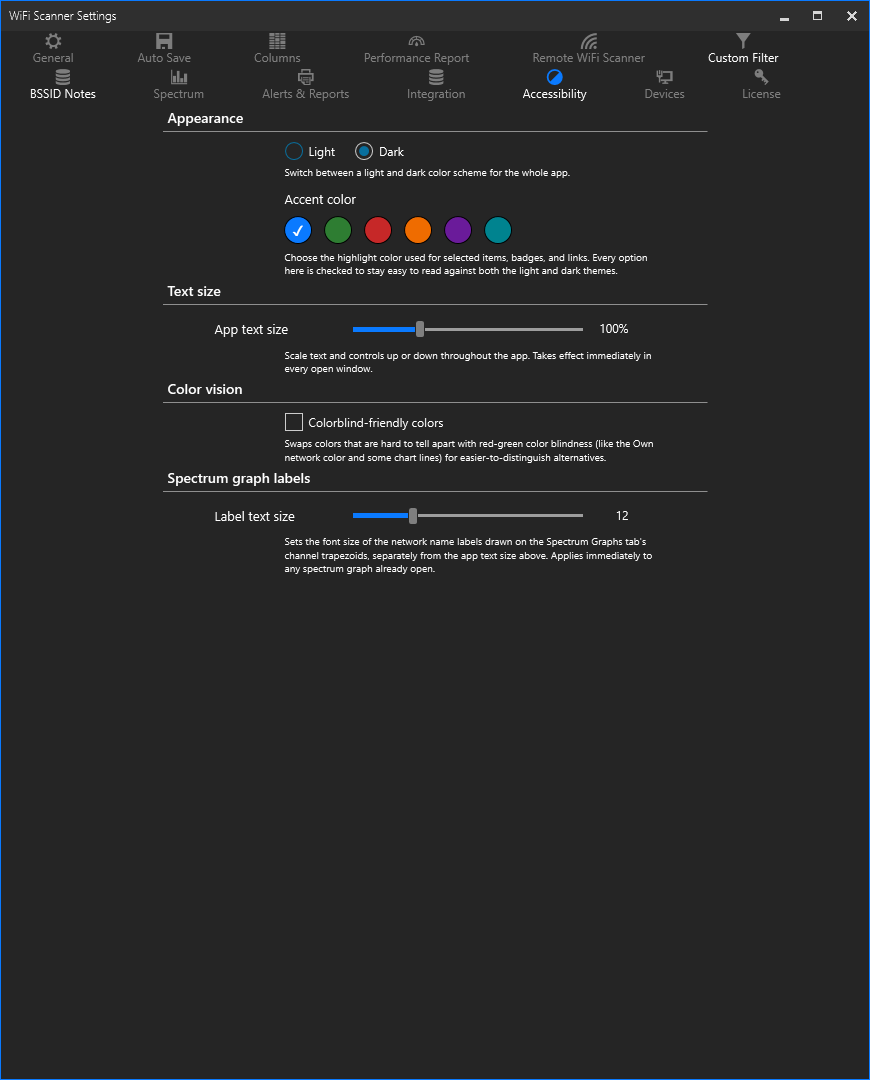
Appearance
The Light/Dark Theme toggle lives here, alongside the other appearance settings.
Text size
A slider (10% steps) scales text and controls across every window in the app (Scanner, Settings, Survey, and every dialog) and applies immediately, no restart required. It runs from 80% to 150%, up or down from the default.
Color vision
A single Colorblind-friendly colors checkbox swaps the colors most likely to be confused under red-green color blindness: the "own network" grid/graph color moves from green to blue (red is left alone, since that's the one color that should keep meaning "alarm"), and the same swap applies to the RSSI-vs-time graph, channel graphs, and the grid's color-swatch column. The heatmap gains a matching blue-to-orange colorblind-safe gradient in its existing palette-cycling bar, and speed test markers below the minimum requirement switch from a solid to a dashed red ring, so that flag doesn't rely on color alone to read as "different."
A separate accent color picker offers six curated colors, each checked to hold readable contrast against both the light and dark themes, narrower than the full stock accent list, but contrast-guaranteed.
Spectrum graph labels
A separate 8 to 24pt slider controls only the size of the SSID labels drawn on the Spectrum Graphs trapezoids (2.4/5/6 GHz), independent of the whole-app Text Size setting above, useful if you want those labels larger without scaling every other window in the app. Applies immediately to any spectrum graphs already open, no restart required.
Settings → License
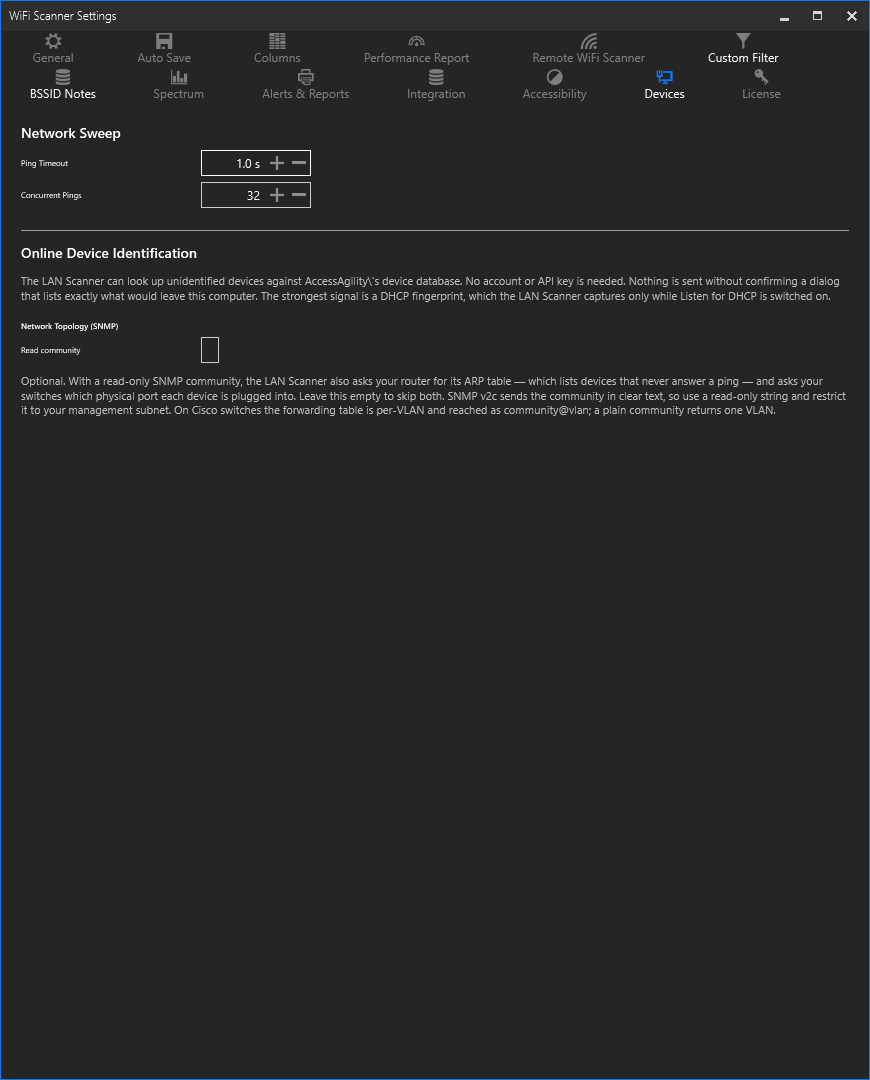
On a trial, this tab shows your trial status, a box to paste in a license key, an Activate button, and a Buy Now link.
Once licensed, it shows License Type, your license key (masked; click the copy icon to copy the real key for a support ticket), and License End Date, plus two buttons: Refresh (re-checks your license without re-entering the key; use this after renewing, upgrading, or adding an add-on) and Deactivate (frees up this computer's license slot so you can activate it on another machine, Windows or Mac).
Your Modules below lists every add-on and whether it's active on your license. It is the one place in the app that shows the full module list. RF Monitor (channel-lock monitor mode and client visibility; requires additional hardware like a Raspberry Pi) is bundled into a Pro license rather than sold separately.
Title Bar Controls
| Control | Purpose |
|---|---|
| Scanner / Copilot / Performance / WiFi Survey pills | Switches the app's four top-level tabs; also toggleable between Scanner and WiFi Survey with Ctrl+W. |
| Alerts bell icon | Opens the Alerts drawer; its badge shows a live count for the currently-selected AP. |
| Scan Interface dropdown | Choose which adapter (or remote source) to scan with. |
| Spectrum Analysis menu (appears once hardware is detected, or always if set in Settings) | Disconnect, toggle Live/Average/Maximum/Utilization traces, toggle Density/Waterfall overlays, and Reset accumulated data. |
| 2.4 / 5 / 6 band pills | Select (and, if not yet connected, also trigger connecting) which band the spectrum analyzer streams. |
WiFi Scanner / File / Help Menus
WiFi Scanner menu
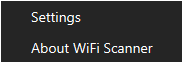
- Settings: opens the settings window covered above.
- About WiFi Scanner: see below.
File menu
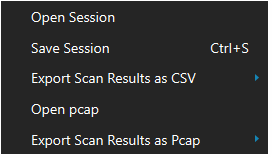
- Open Session: load a previously saved session (offers to save current results first).
- Save Session (also
Ctrl+Sanywhere in the app): save the current session, including speed-test history, to a file. A saved or exported session file contains only scan data; it never includes your SSH device or Integration credentials. - Export Scan Results as CSV → All / Displayed / Selected Rows.
- Export Scan Results as Pcap → All / Displayed /
Selected Rows, saved as
.pcapor.pcapng. Synthesizes a Radiotap and 802.11 beacon frame around each AP's real, captured Information Elements, so scan data can be opened directly in Wireshark or any other pcap-reading tool. - Open pcap: import APs from a raw
.pcappacket capture instead of live scanning.
Help menu

- Visit Support Website: opens AccessAgility's support site.
- Check For Updates...: manually checks for a newer version.
Ctrl+W toggles between the Scanner and WiFi Survey tabs, a shortcut with no menu
entry.
About Window
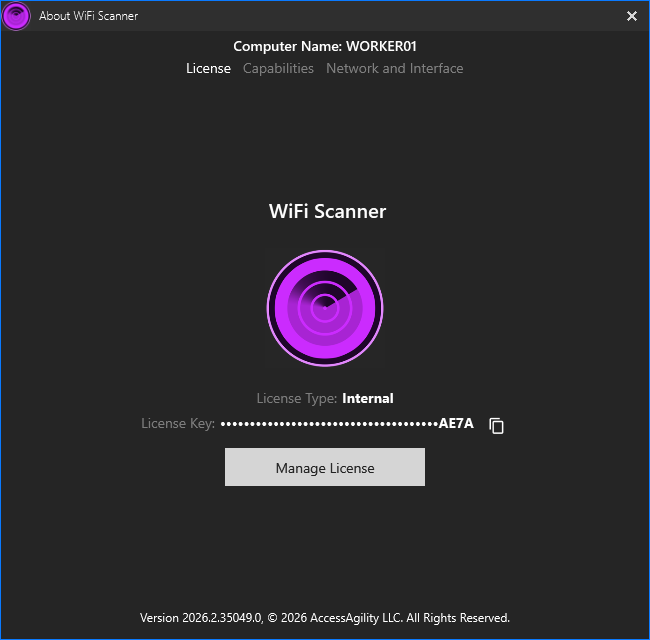
Three tabs: License (License Type and your license key, masked by default (click the copy icon to copy the real key for a support ticket), plus a Manage License button that opens Settings → License), Capabilities (your WiFi adapter's supported radio types/standards), and Network and Interface (current IP, subnet, gateway, DNS, and adapter firmware, a quick technical fact sheet without leaving the app).
Prompts You'll See
"Would you like to save scanning results?"
Shown before exiting the app or starting a new scan, whenever there's unsaved data and the "always ask" preference is on (General tab). Save prompts for a file first; Don't Save discards; Cancel aborts the exit/new-scan entirely. Check "Don't ask again" to silence this permanently (re-enable it later from General preferences).
"Is this your network?"
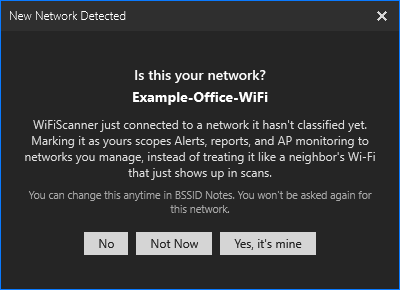
The first time you connect to a network the app hasn't seen classified before, it asks once: Yes, it's mine classifies it Own, No classifies it Neighboring, Not Now dismisses without classifying (the app falls back to passively scoring your connection history instead, and won't ask again for this network either way).