WiFiScanner for Mac: Complete User Guide
What this guide covers
This is the screen-by-screen reference for WiFiScanner's native Mac app, covering the direct-download (non-App Store) build specifically. That's the version whose license activates with a pasted key rather than an in-app purchase. The two builds share the same screens; the only real difference is how the License pane looks and works, called out where it matters.
If you haven't installed WiFiScanner yet, or just want the fast path to your first scan, start with the Getting Started guide instead. It covers installation, the macOS Location-permission step, and the 7-day trial. This guide assumes you're already up and running and want to know what a specific screen does.
Windows and Mac are two separate native apps built to work the same way wherever possible. Where this guide's screens differ meaningfully from the Windows app, see Where This Differs From Windows at the end, or go straight to the Windows Complete User Guide if that's the platform you're on.
WiFi Scanner tab
The default tab and home screen: a live grid of every WiFi network your Mac's WiFi adapter (or a connected remote SSH sensor) can see, with a filter tree on the left and spectrum/signal/SSID/alert views along the bottom.
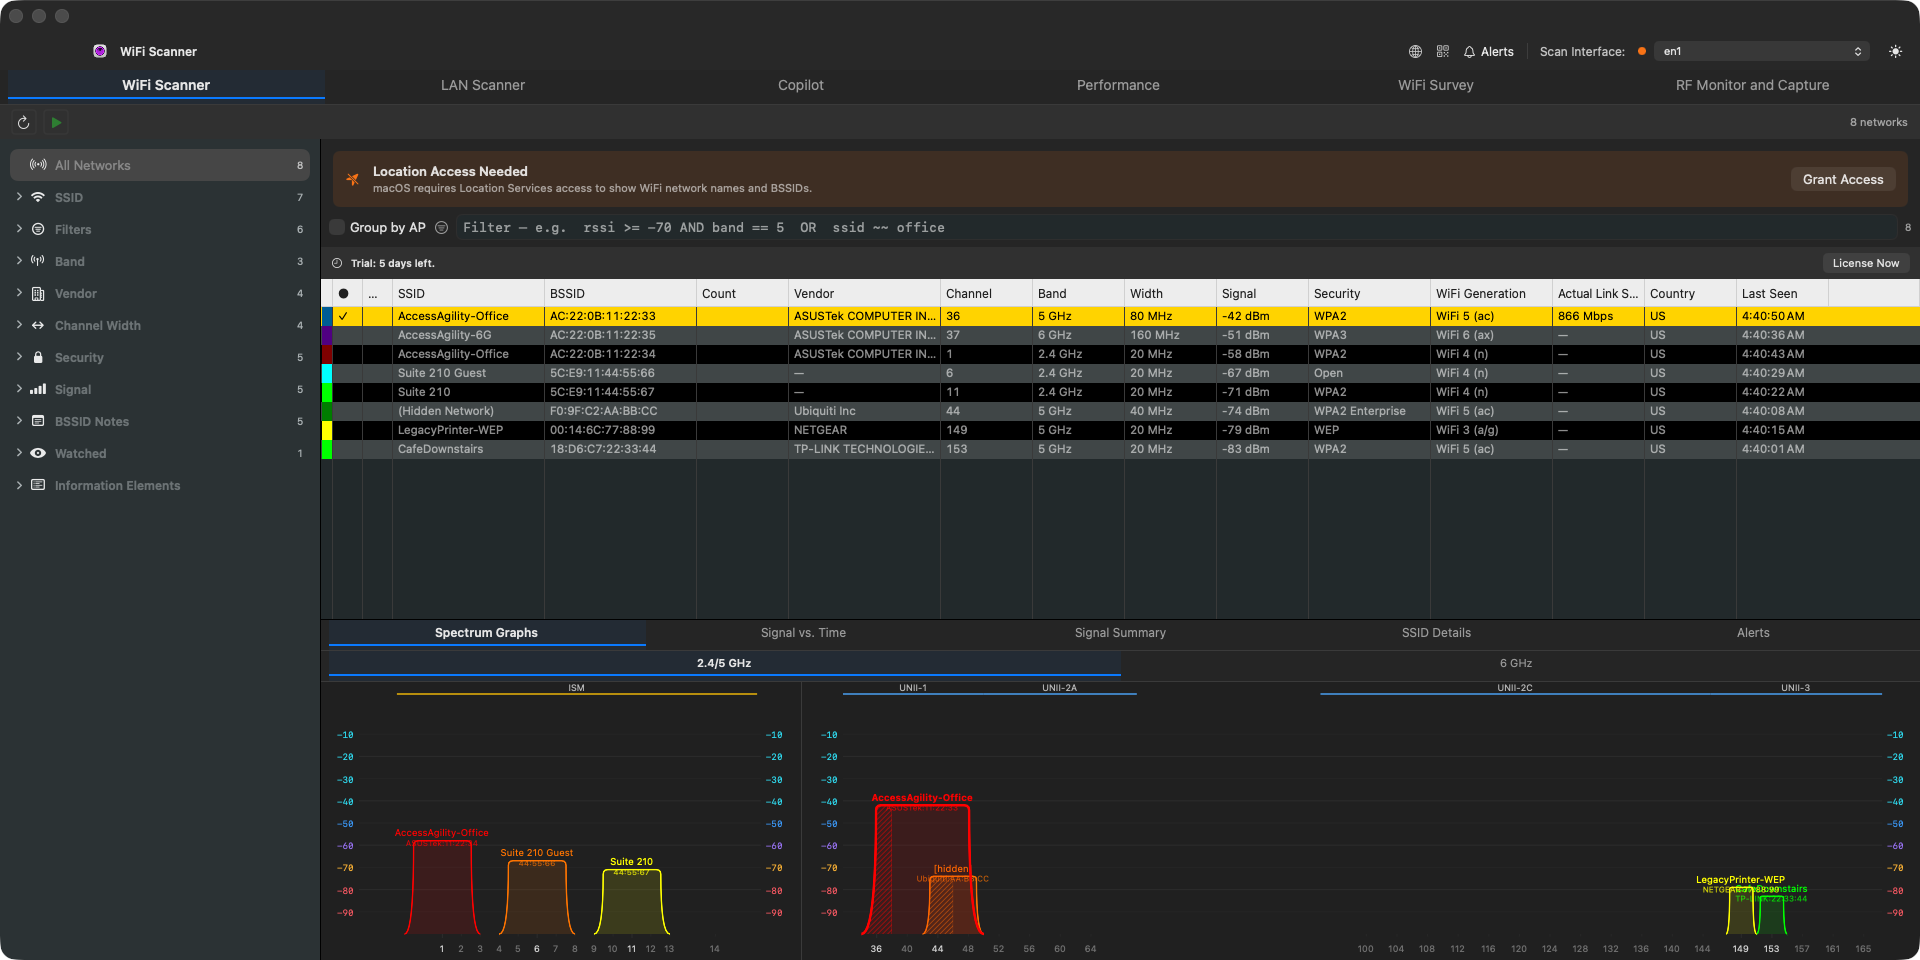
The Location Access Needed banner shown here appears until you grant Location permission. macOS requires it before any app can reveal real network names (SSIDs) and BSSIDs, even though WiFiScanner never stores or transmits your location. Click Grant Access and approve the system prompt; the grid then updates live as networks are discovered, with no separate "start scan" button to press.
A network's Vendor comes from its BSSID's registered OUI. A randomized or locally administered BSSID has no registered OUI, so its vendor comes from the beacon instead: the WPS-advertised manufacturer if there is one, otherwise the AP maker's own vendor-specific element (for example Cisco Meraki). Elements that name a standard or a chip rather than the AP maker - WMM and WPA under Microsoft's OUI, Broadcom, Qualcomm and similar - are skipped. The rule is the same on Windows.
The left filter tree groups results by Band, SSID, BSSID, Signal, Vendor, Channel, Channel Width,
Mode, Security, saved Filters, BSSID Notes, Watched status and Information Elements, in
that order. It is the same order, under the same names, as Windows. Channel rows read in
numeric order; Mode is the newest 802.11 mode the AP advertises (802.11ax, 802.11be), as
the Mode column shows it. Click a row to filter the grid by that row alone, and ⌘-click to add or
remove more rows. Rows in
the same group widen the filter (two SSIDs means either), rows in different groups narrow it (an SSID
and a band means both). Press Space to switch the row you most recently added between is and
is NOT, and click All Networks to clear. The arrow keys move through the tree and the grid follows, just as clicking does. Whatever you pick is written into the Filter box. The Information Elements group is built from the scan itself: one row per 802.11 element any
AP is broadcasting, with how many APs carry it. To filter on a decoded value, type it into the Filter
box as dot11.<element>.<field> == "value". SSID Details at the
bottom decodes the selected AP's beacon down to the bit: HT, VHT, HE and EHT capabilities, Transmit
Power Envelope, RSN and RSNXE, WMM and MU EDCA, Spatial Reuse, and the AP name thirteen vendors
broadcast. Columns stay where you put them: a re-shown column returns to its old place and a new one
appears on the right. Group by AP
(checkbox above the grid) collapses every BSSID of one physical access point into one row, across all its
bands: the SSID column lists every network it broadcasts (Hidden first if any are hidden), the
BSSID column shows its address with the last digit as # (the one digit the grouping
ignores) and Count shows how many BSSIDs were merged. Settings → General → Only group BSSIDs on
the same channel keeps each radio on its own row instead.
The Filter box accepts typed expressions like rssi >= -70 AND band ~~ 5
or ssid ~~ office for more precise slicing than the tree alone. A band can be written as
a number: band == 5, band == 5ghz and band == "5 GHz" all mean the
same thing, on both Mac and Windows.
The filter applies to the panes below the grid too: Spectrum Graphs, Signal vs. Time, Signal Summary and Alerts show only the networks it keeps. With Group by AP on, the graphs draw one line per AP, as the grid shows one row. The setting that keeps your connected network visible while filtering applies to the grid only. Alerts that are not about one network always show.
Along the top-right: Scan Interface picks which adapter (or remote source) to scan from; the Alerts bell opens the diagnostic alerts drawer; the globe and QR-code icons (visible once Remote Scanner is licensed) generate a browser share link and a Zero-Touch pairing code, covered in the Windows guide's equivalent sections since the underlying features are shared.
Scanning via an SSH sensor
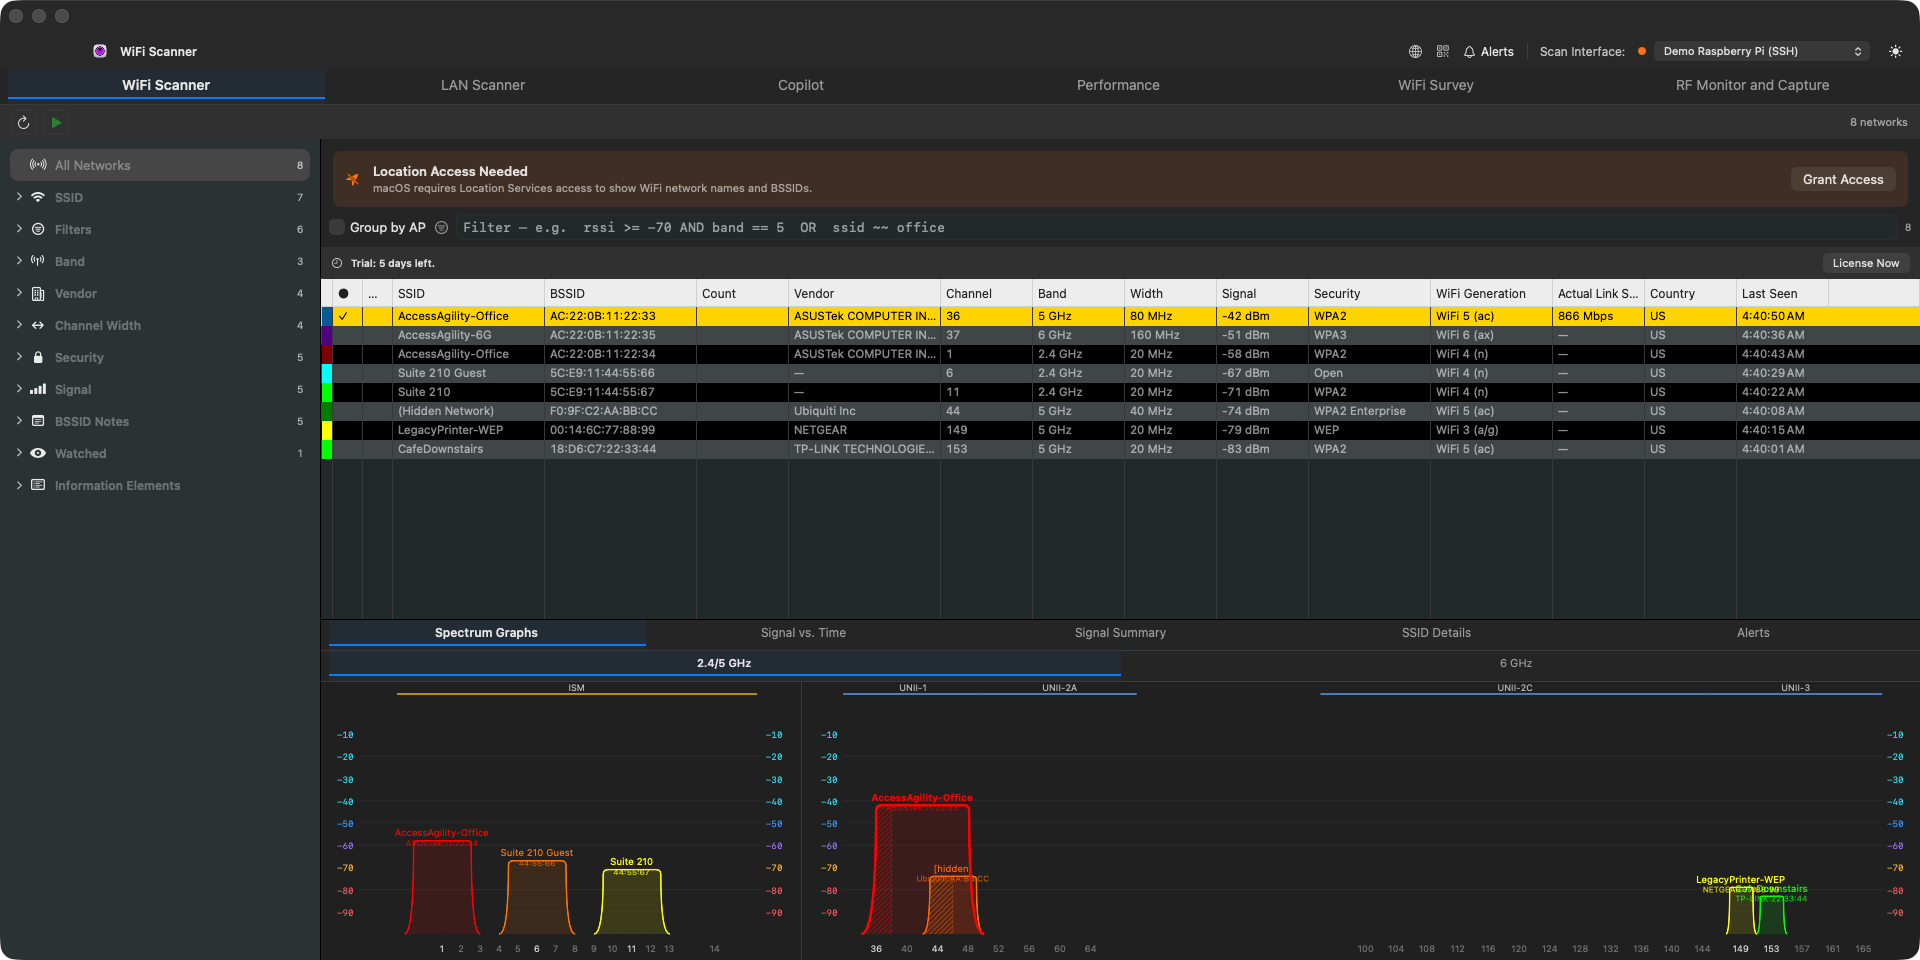
Any SSH sensor device you've configured (Settings → Remote Scanner) shows up as its own entry in the Scan Interface dropdown, right alongside your Mac's own WiFi adapter. Selecting it streams that device's scan results into the same grid, filters, and graphs as a local scan. This is how you survey a site remotely: a Raspberry Pi (or similar Linux box with a WiFi adapter) runs the sensor side over SSH, and your Mac does the analysis.
Alerts drawer
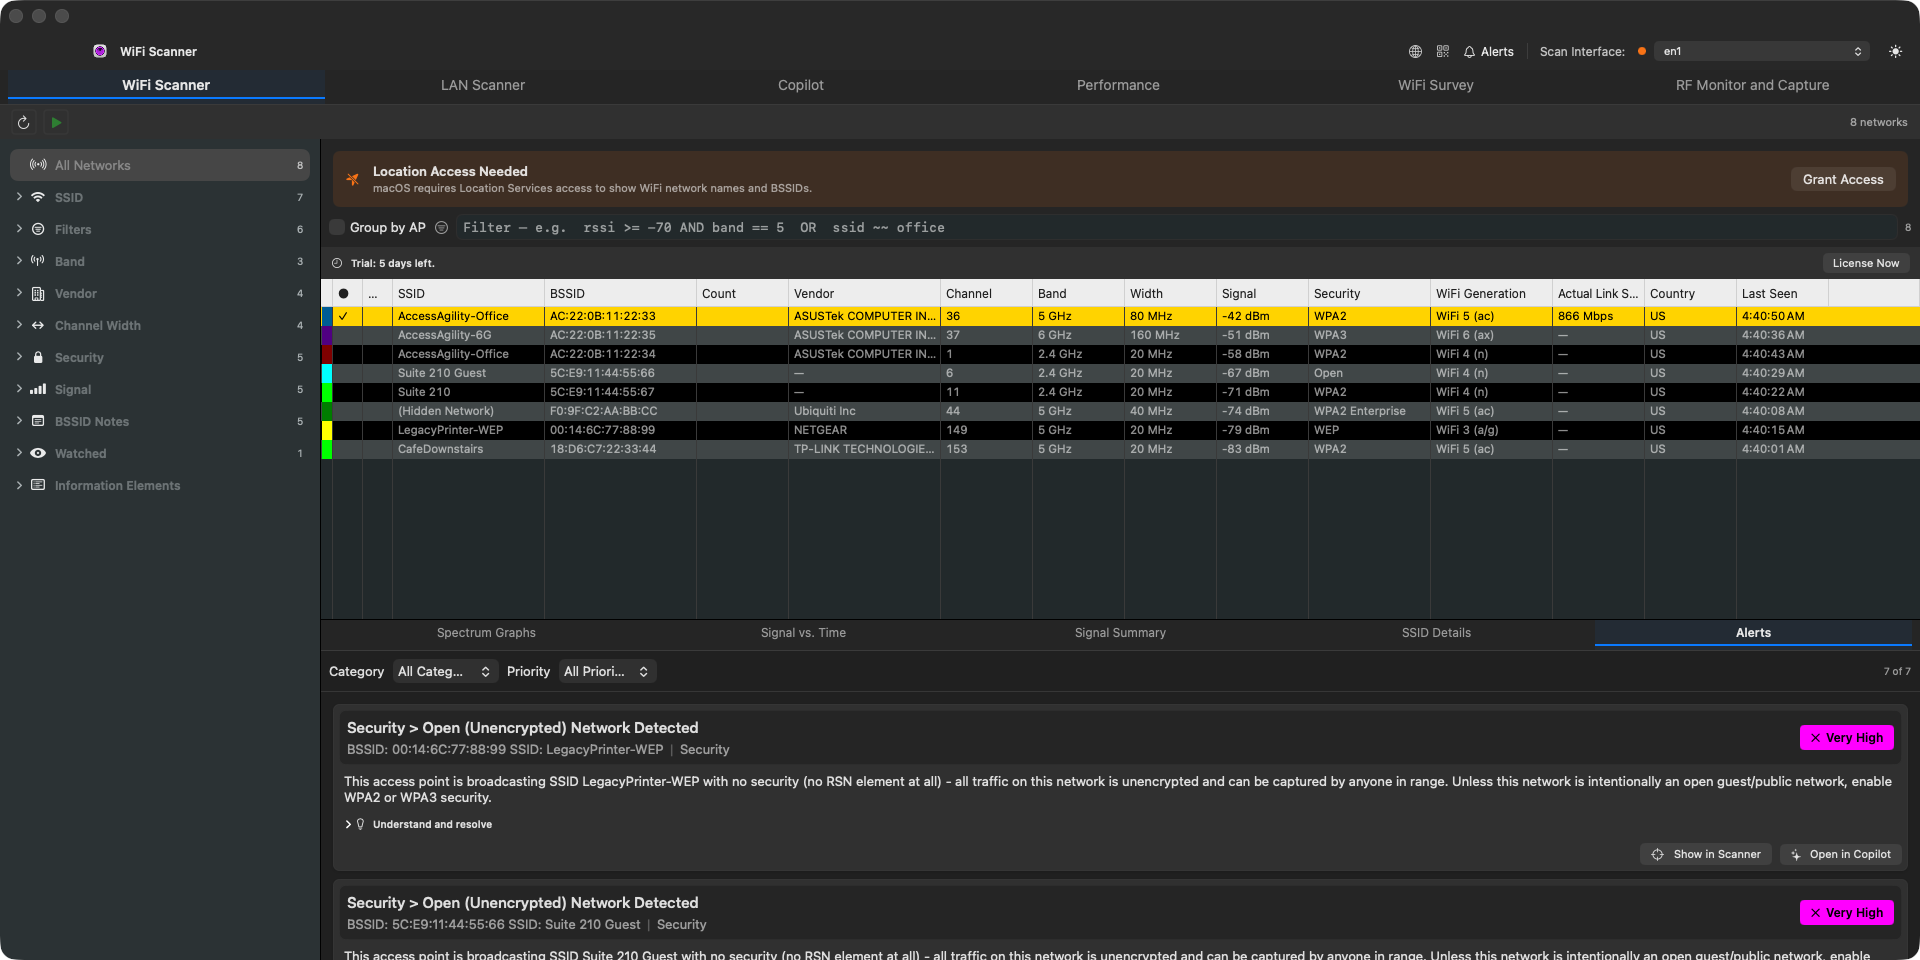
Reached via the Alerts bell in the title bar, or the Alerts tab alongside Spectrum Graphs/Signal vs. Time/Signal Summary/SSID Details at the bottom of the Scanner tab. Each card names the specific BSSID/SSID behind the finding, explains what's wrong in plain language, and offers Show in Scanner (jumps to and selects that row) or Open in Copilot (routes to the matching outcome card), the same evidence-routing Copilot's own cards use, so you land in the same place whichever direction you start from.
LAN Scanner tab
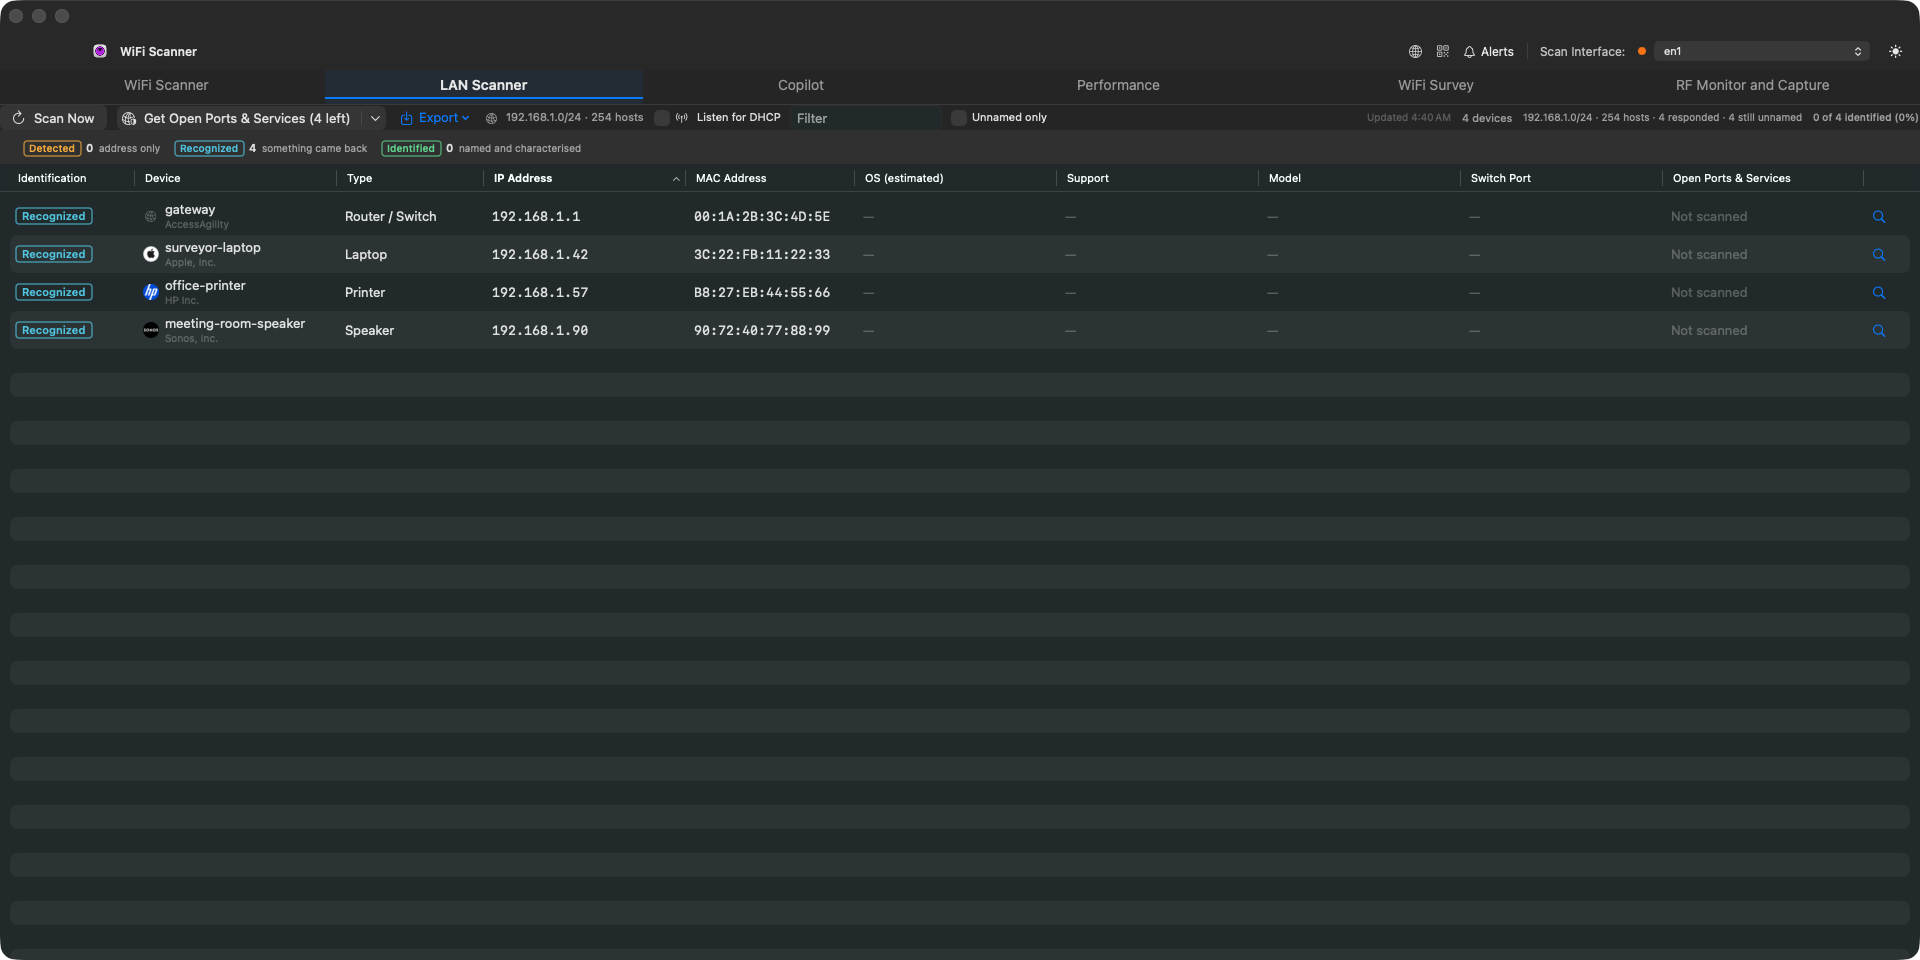
The other half of the picture. WiFi Scanner scans the air; LAN Scanner scans the wire: every device answering on your local subnet, not just the wireless ones: phones, laptops, printers, cameras, NAS boxes, consoles, anything with an IP.
Nothing runs until you ask. Scan Now sweeps the subnet and lists each device with its address, MAC, vendor and whatever the scan could work out about what it is; Stop halts a scan in progress. Get Open Ports & Services probes the devices found and reports what each one is listening on, which is often what actually identifies a box the vendor lookup could not.
Listen for DHCP is off by default and worth turning on for a long session. It is passive and local (it binds UDP 67 and reads broadcasts, transmitting nothing), and a device's DHCP fingerprint is the strongest identification signal available without credentials. It only catches a device while it joins, reboots or reconnects, so one already holding a lease stays quiet until it renews; leave it running rather than expecting instant results.
Export writes what the table shows, in the table's own column order, so the file matches the view.
Copilot tab
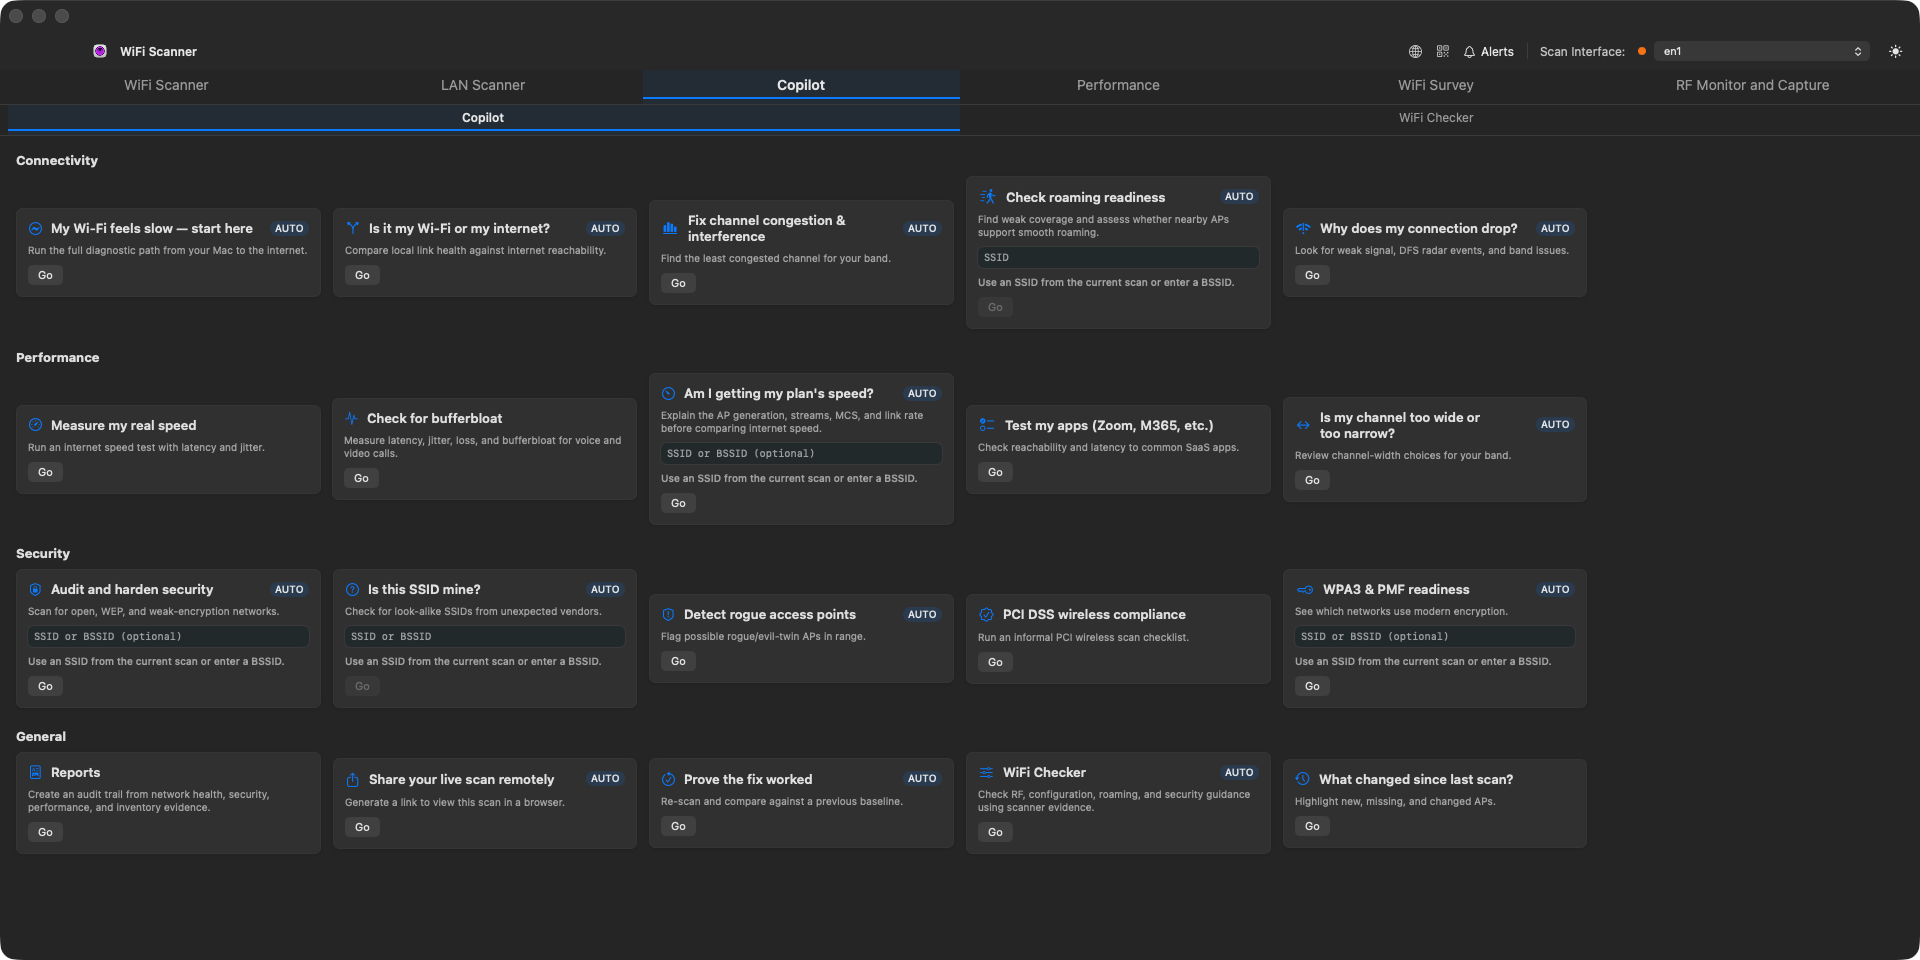
Rather than making you know which screen answers your question, Copilot leads with the goal itself, "My Wi-Fi feels slow," "Detect rogue access points," "Check roaming readiness," each as its own card. Cards badged AUTO run their action immediately when clicked (a diagnostic, a scan comparison, a report) instead of just routing you to the right screen to finish manually. Cards that need a specific network first show an SSID/BSSID field, pre-filled when you arrived from a specific row in the Scanner grid.
Security check an SSID, Is this SSID mine?, Check roaming readiness and Why is my speed capped? take an SSID, or a BSSID to check the network it belongs to, and run the same checks, in the same words, as on Windows. Why is my speed capped? also accepts a blank field for the network you are connected to, and reads the AP's Wi-Fi generation, width, streams and maximum rate from its beacon to say whether signal, channel width or 2.4 GHz is limiting it. Fix channel congestion & interference recommends the least busy channel on each band, counting physical AP radios weighted by signal and, on 5 and 6 GHz, every channel a radio's width covers. It chooses among the channels the beacons' own Country element says your country allows, so it can name a channel nobody is using, recommends DFS channels where the AP can detect radar and names the best non-DFS channel alongside them, and flags up to three other crowded channels - the same result as on Windows. Why does my connection drop? names the conditions in the air that cause a drop - a signal at the edge, nowhere to roam, a radar channel, a saturated one - each with its evidence, and says plainly when none of them apply and when a scan simply cannot see the cause. WPA3 & PMF readiness places every BSSID on the road to WPA3 and names the one next step - the step the furthest-behind BSSID needs - rather than counting how many advertise WPA3 as it used to. Is my channel too wide or too narrow? weighs the width your AP runs against the APs whose channels overlap it - whether widening would take on no extra company, or narrowing would shed some - rather than counting wide BSSIDs across the whole scan as it used to. Is it my WiFi or my internet? compares the rate your radio agreed, what crossed the air to your router, and what reached the internet, and names which leg is losing the speed - scoring each against what it should manage, since the air never carries the whole negotiated rate. Run the local throughput test once so it has the middle number. Getting your router's full Wi-Fi 6E/7 speed? names the fastest radio the network has, says whether it is 6E or Wi-Fi 7 or neither, and measures your link against that radio's ceiling - naming whether a weak signal, your adapter's width and streams, or the air is holding the rest back. VoIP / real-time comms readiness checks a network against voice best practice (signal, channel utilisation, 802.11r/k/v, WMM, TKIP, basic rates, SSIDs per radio) and your latest network-quality test, with the same thresholds and words as Windows. PCI DSS wireless compliance checks that an AP is classified Own and all eight self-attestation questions are answered, then saves the report as a dated PDF and opens it. Security check an SSID reads what each BSSID advertises in its beacon (Open, WEP, WPA, WPA2, WPA3 or Enhanced Open, TKIP and PMF) and flags what to fix. Audit and harden security opens the Scanner's Alerts drawer.
In the Scanner grid, the narrow Wi-Fi and eye columns are Connected (a checkmark on the network this Mac is on) and Watched (an eye on BSSIDs you monitor); hover a header to see which is which.
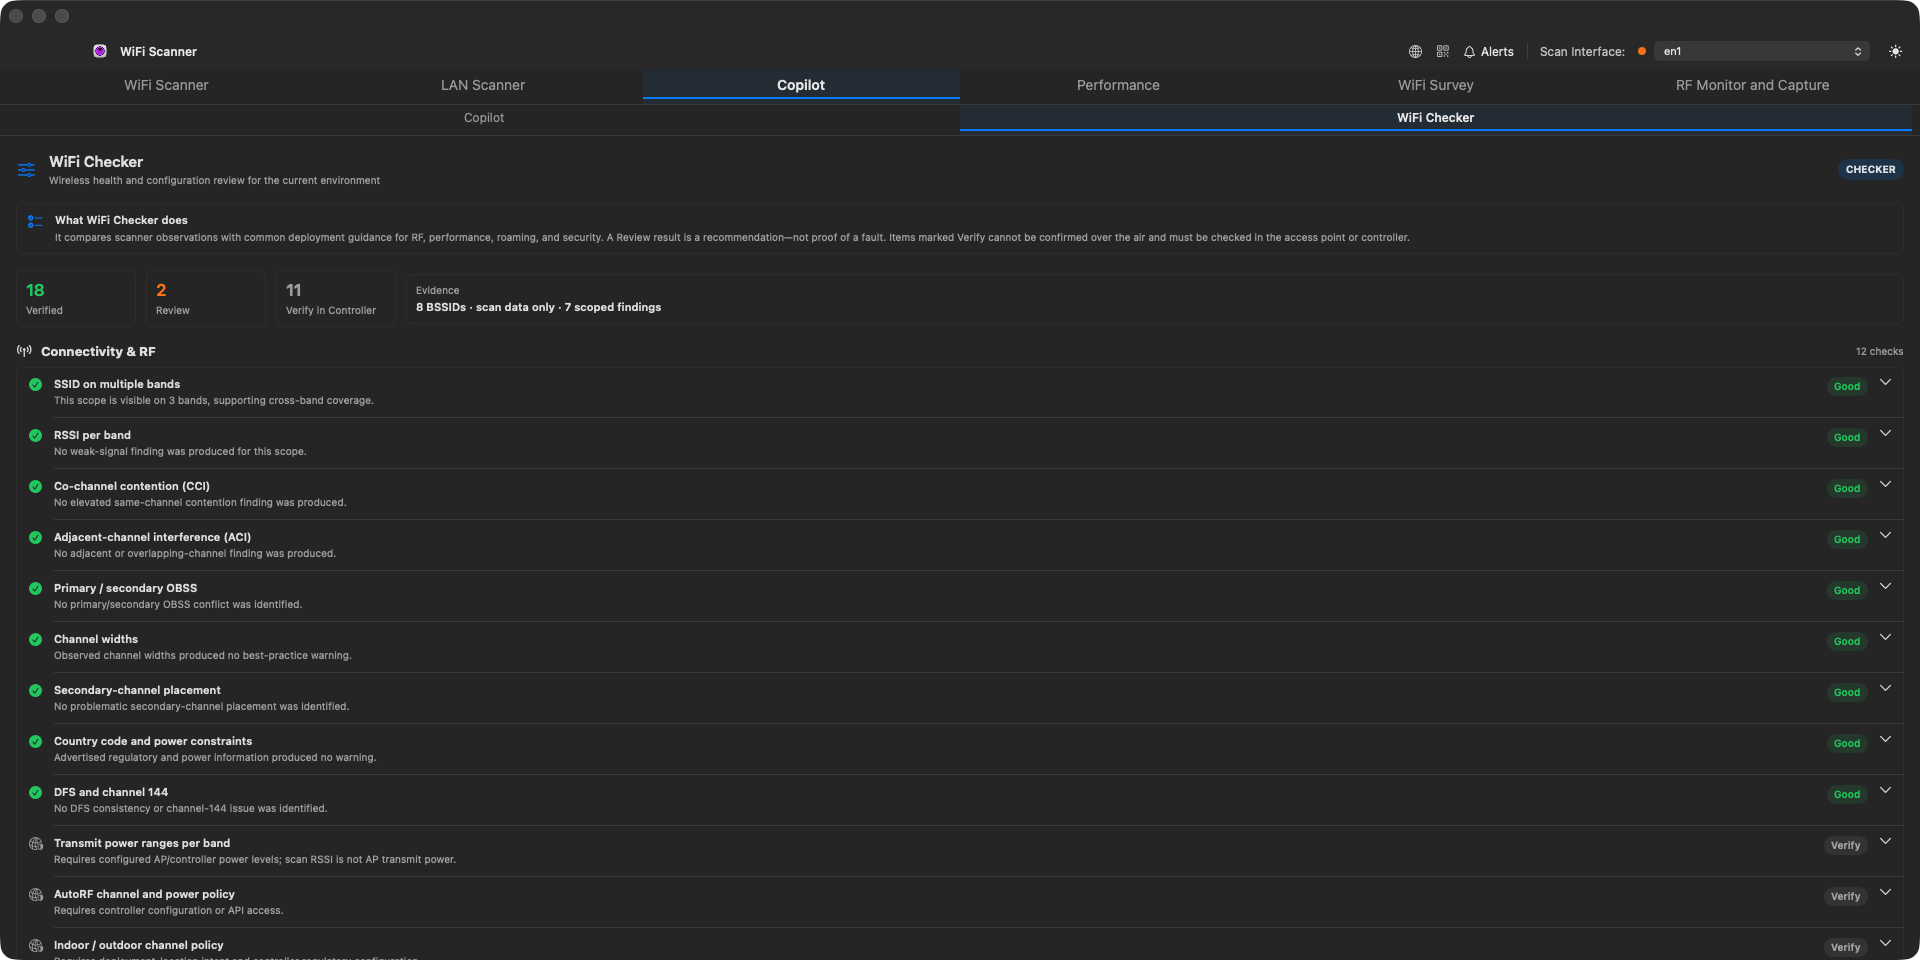
WiFi Checker is a second page within the same tab (not a separate top-level tab). It runs a three-track best-practice audit (RF, configuration, security) and shows its findings with the actual scan evidence behind each one, rather than a bare pass/fail.
Performance tab
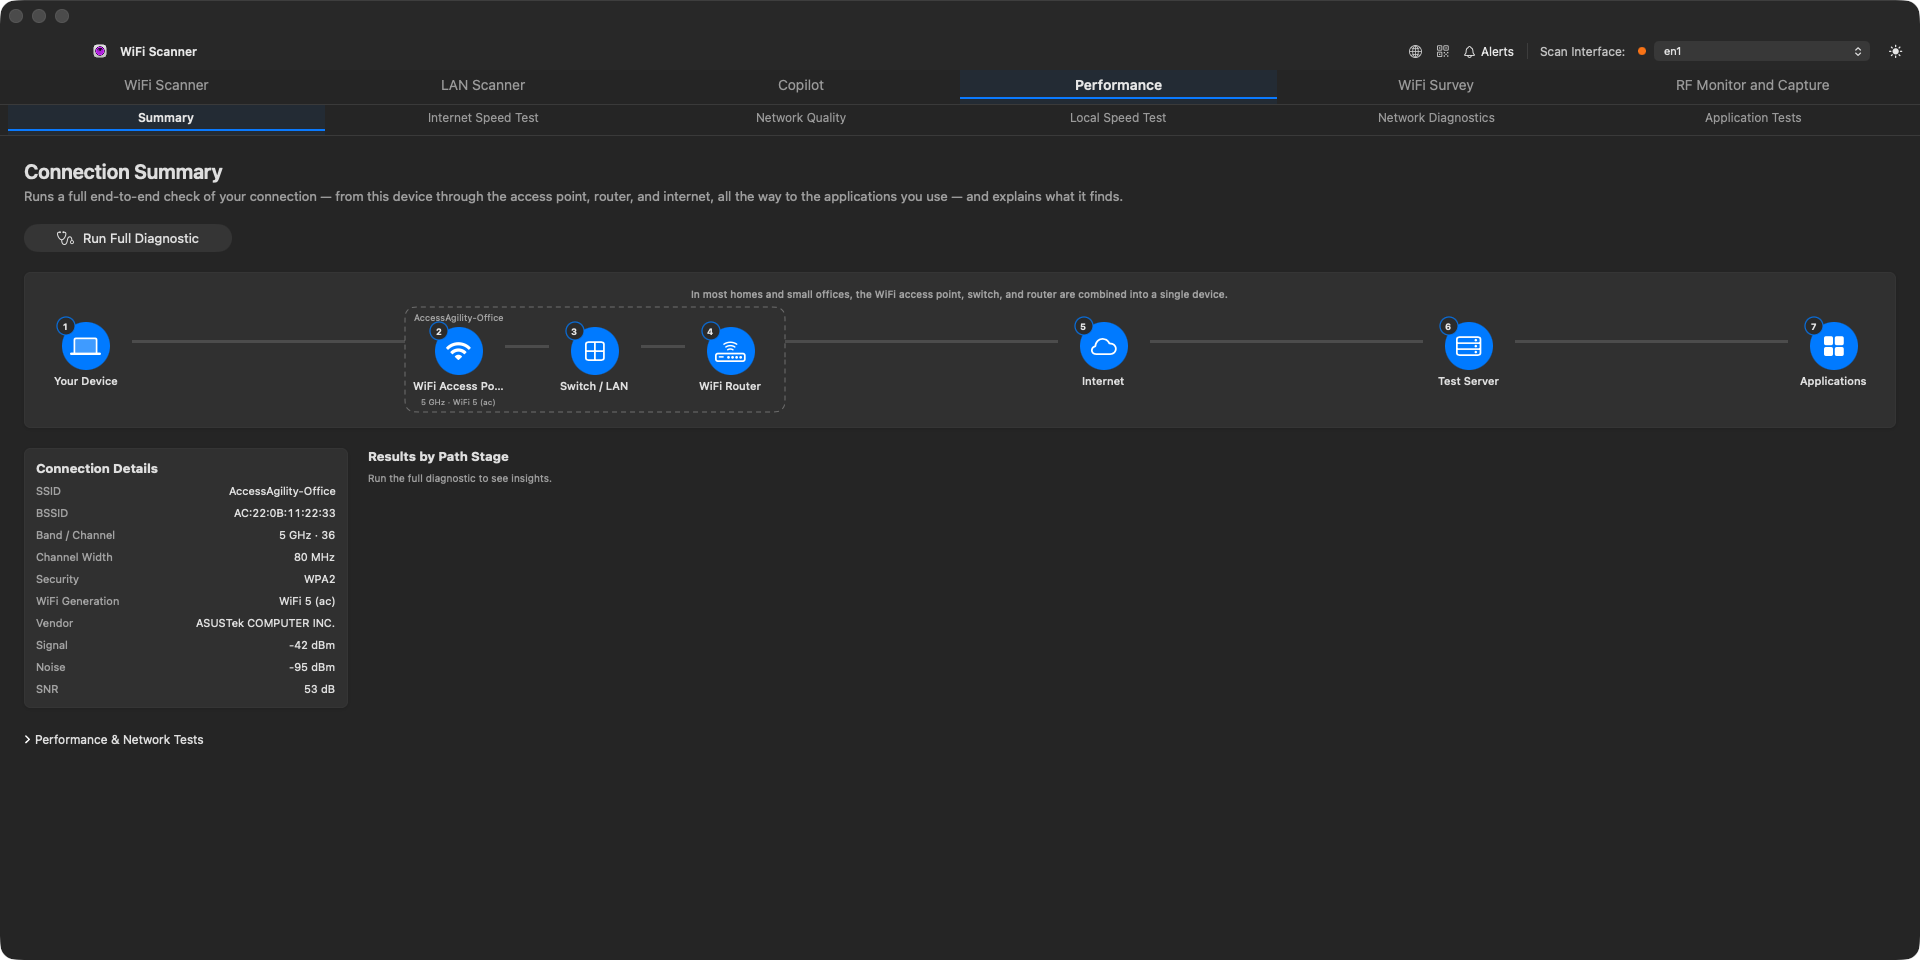
Run Full Diagnostic walks the whole path (your device, the WiFi access point, the switch/LAN, the router, the internet, a test server, and finally the applications you use) and explains what it finds at each stage instead of just reporting a single speed number. The panel on the left shows your current connection's exact details (SSID, BSSID, band/channel, width, security, signal, noise, SNR) pulled straight from the active scan.
Devices, speed tests & diagnostics
Five more sub-tabs sit alongside Summary, each a focused tool. The device inventory used to be a sixth; it is now its own LAN Scanner tab.
| Sub-tab | What it does |
|---|---|
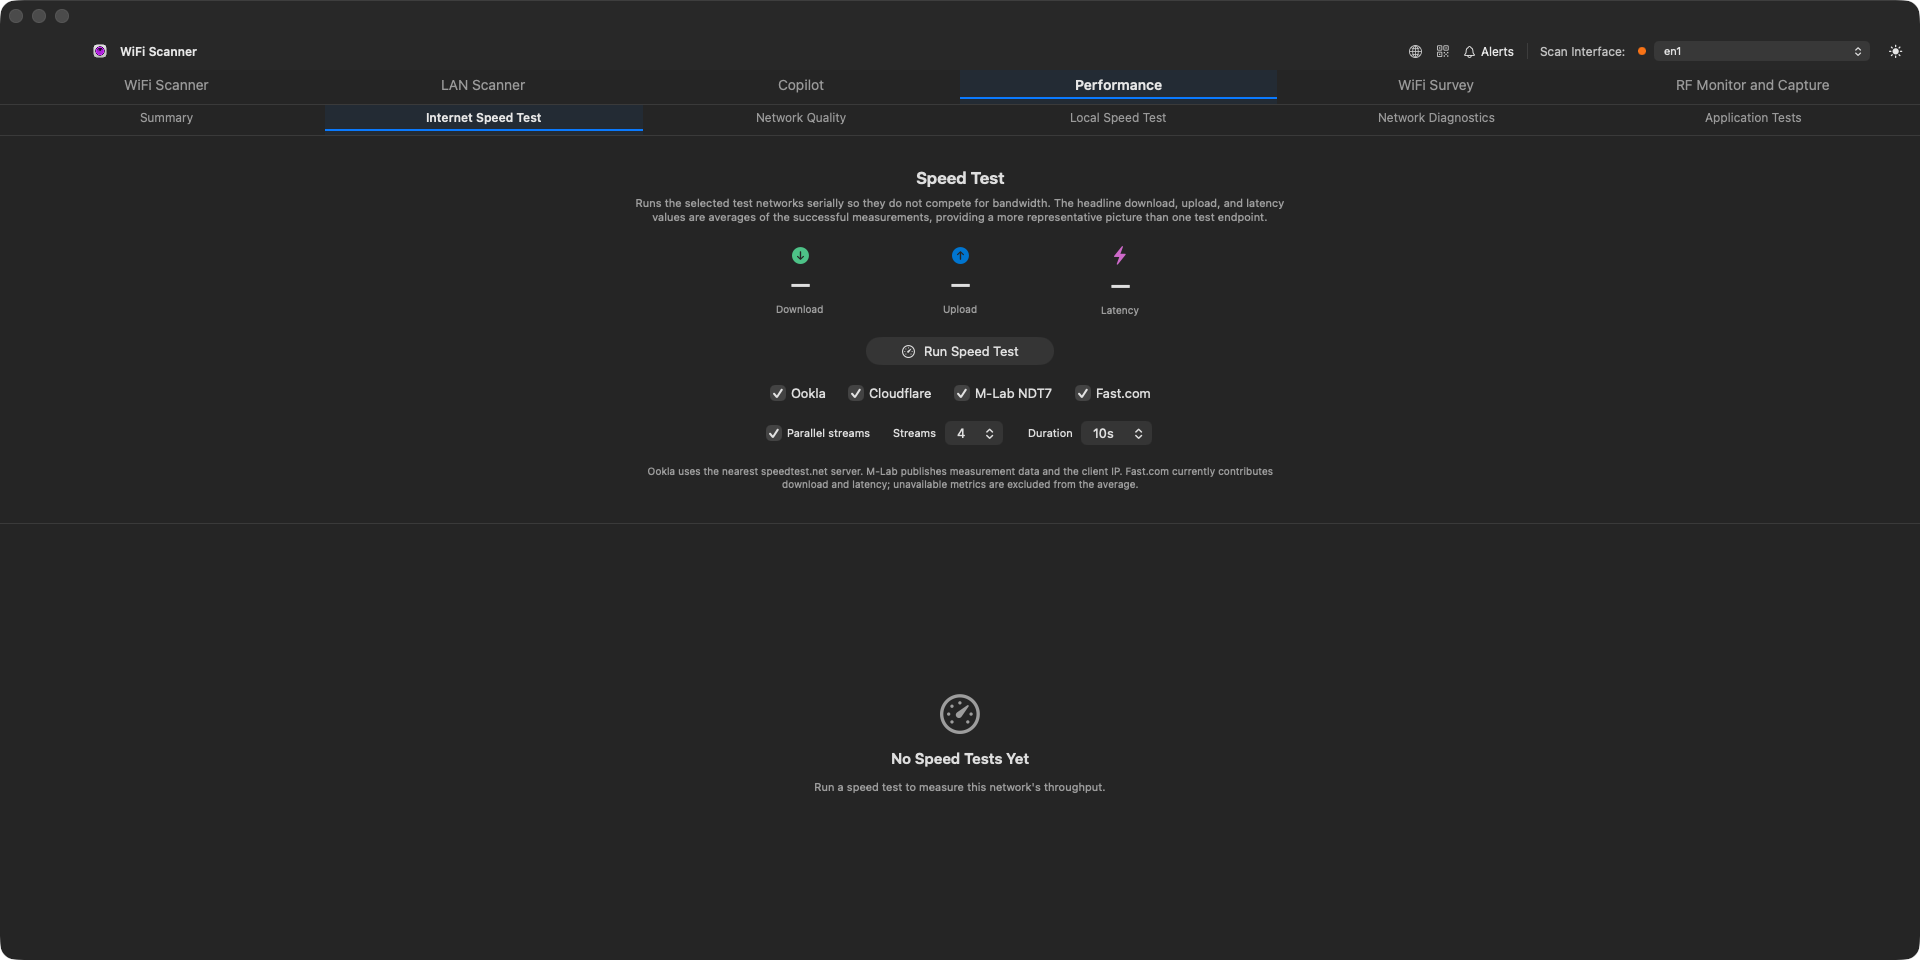
| Internet Speed Test | Download/upload/latency against any of four providers (Ookla, Cloudflare, M-Lab NDT7, Fast.com), each measured the same way: a fixed Duration per direction over your chosen number of Parallel streams, first two seconds excluded while TCP ramps up. Clear Results empties the log. Run Full Diagnostic uses the provider you have chosen and names it in its report. |
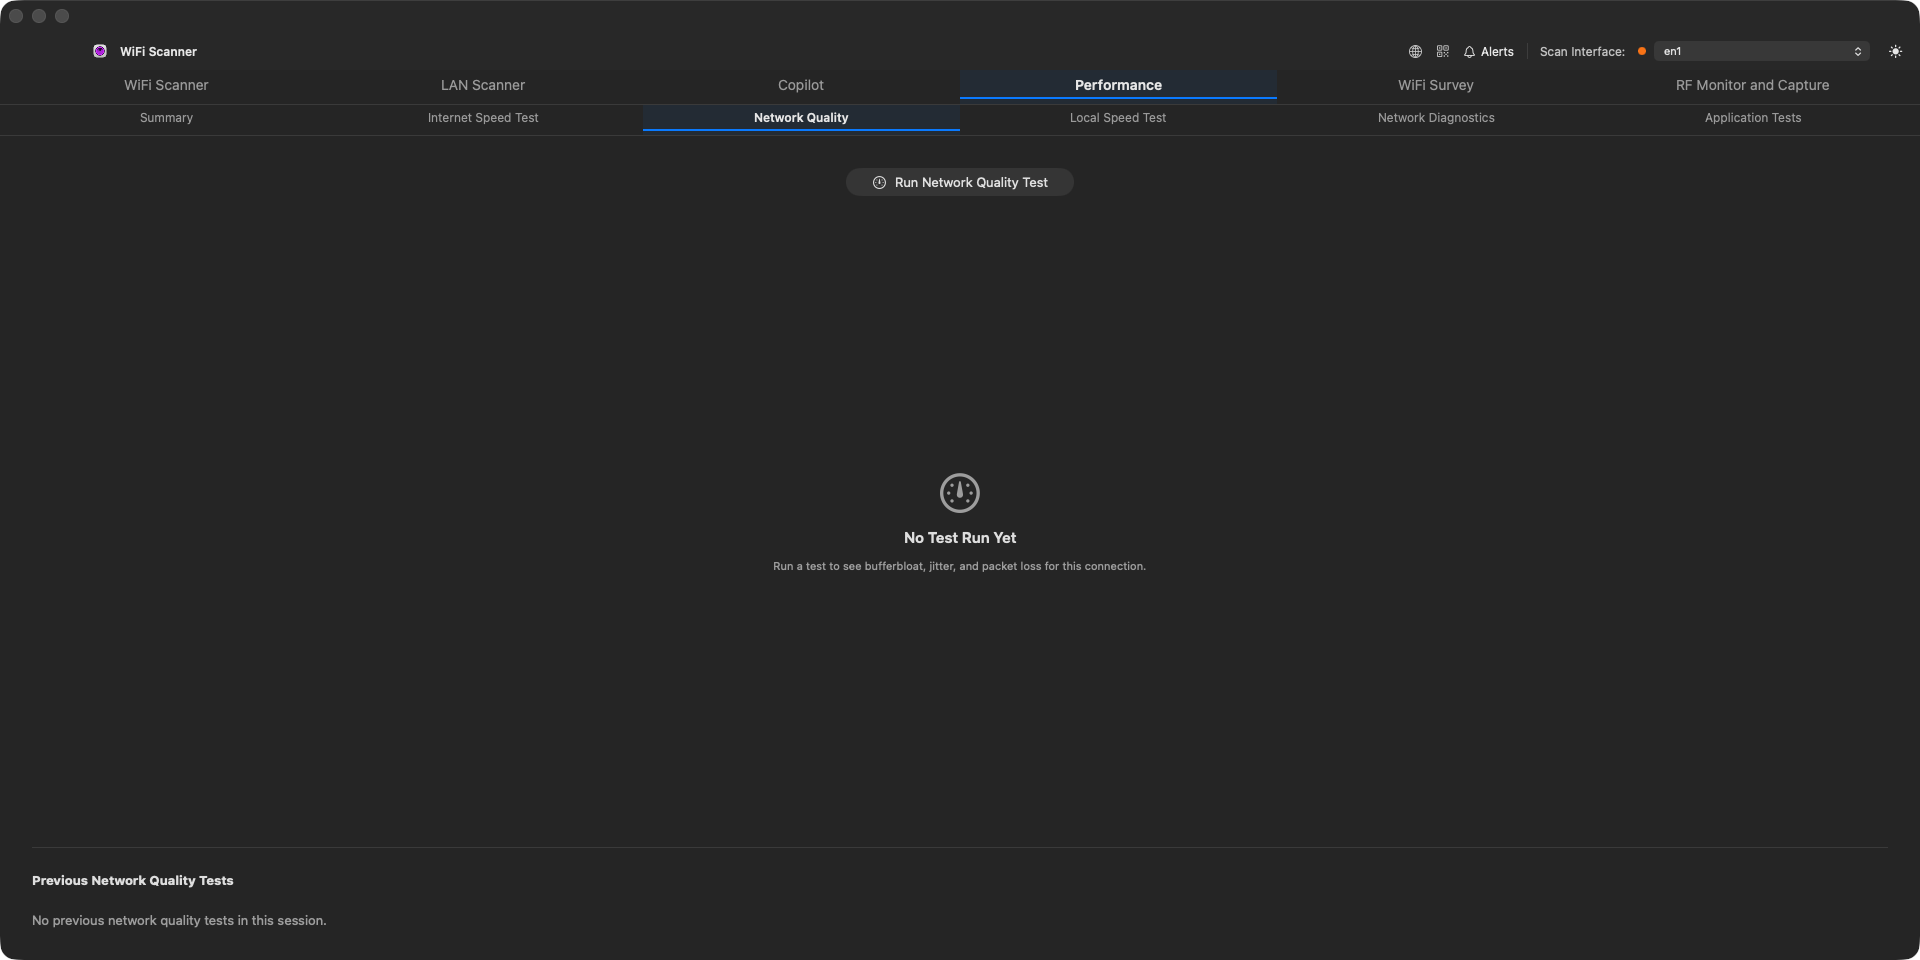
| Network Quality | Latency, jitter, and packet loss: the things a raw speed number hides. |
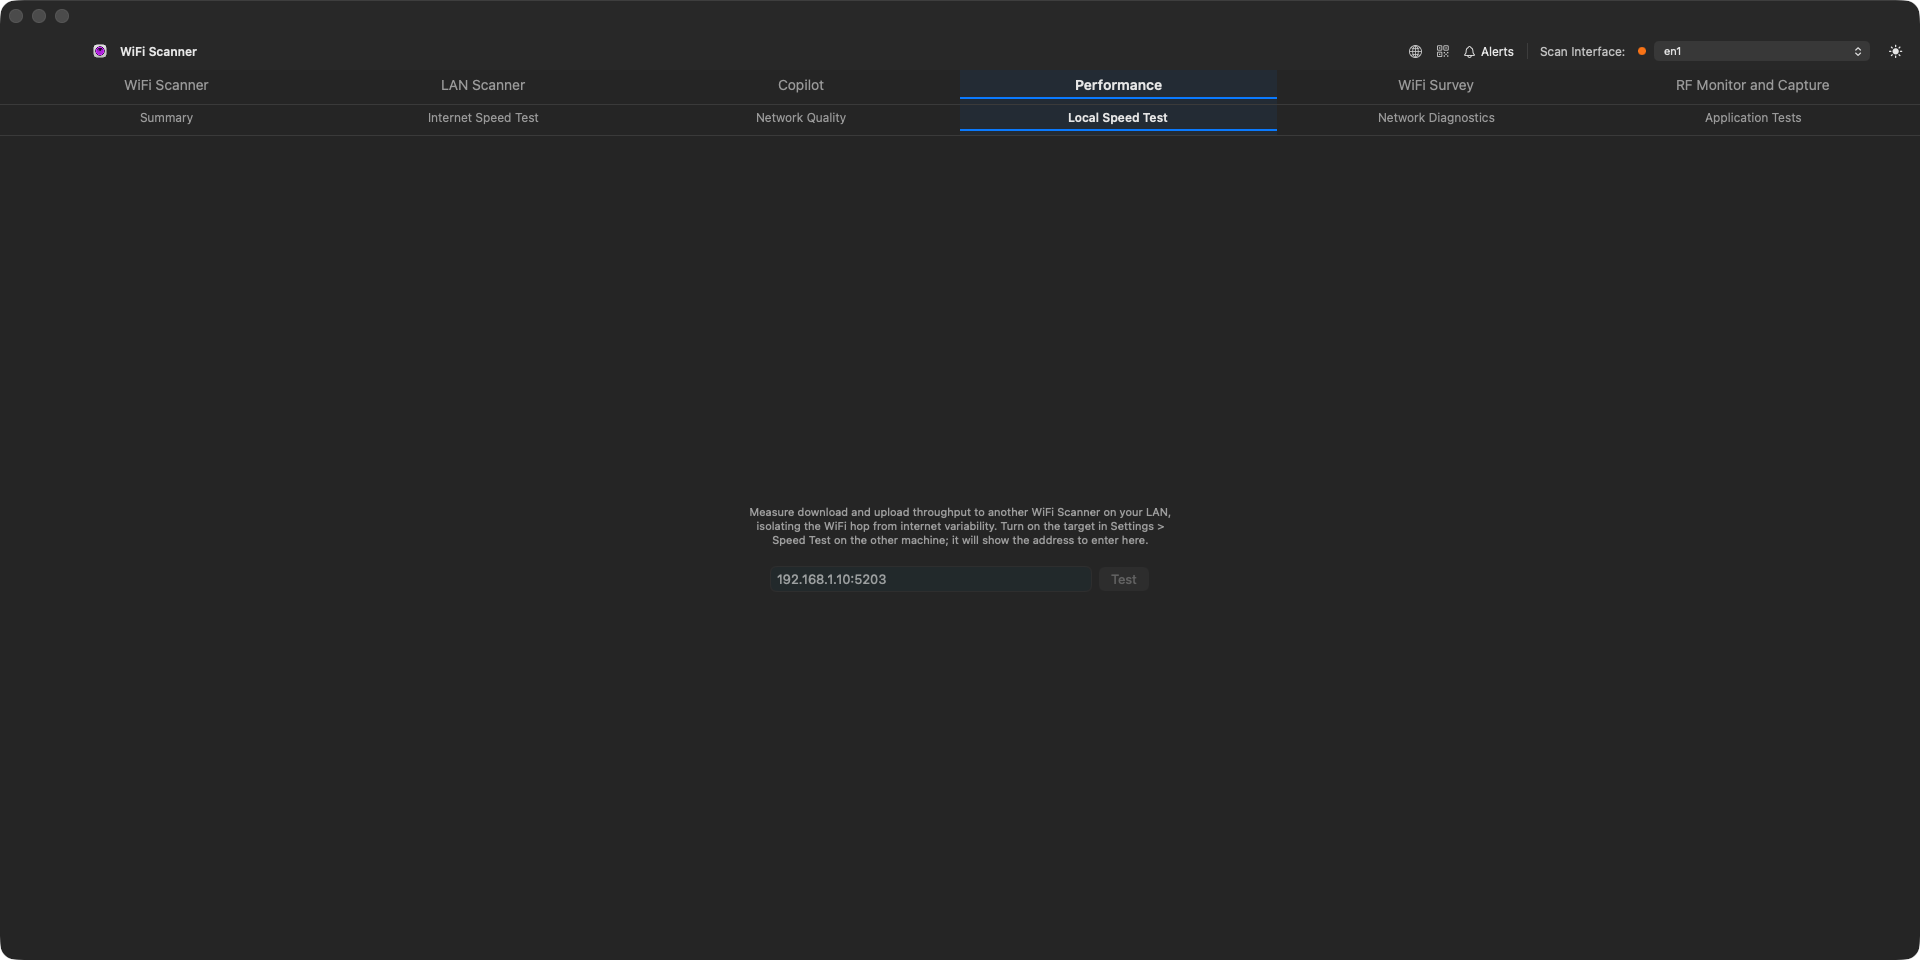
| Local Speed Test | Throughput to a device on your own LAN, isolating WiFi performance from your internet connection. |
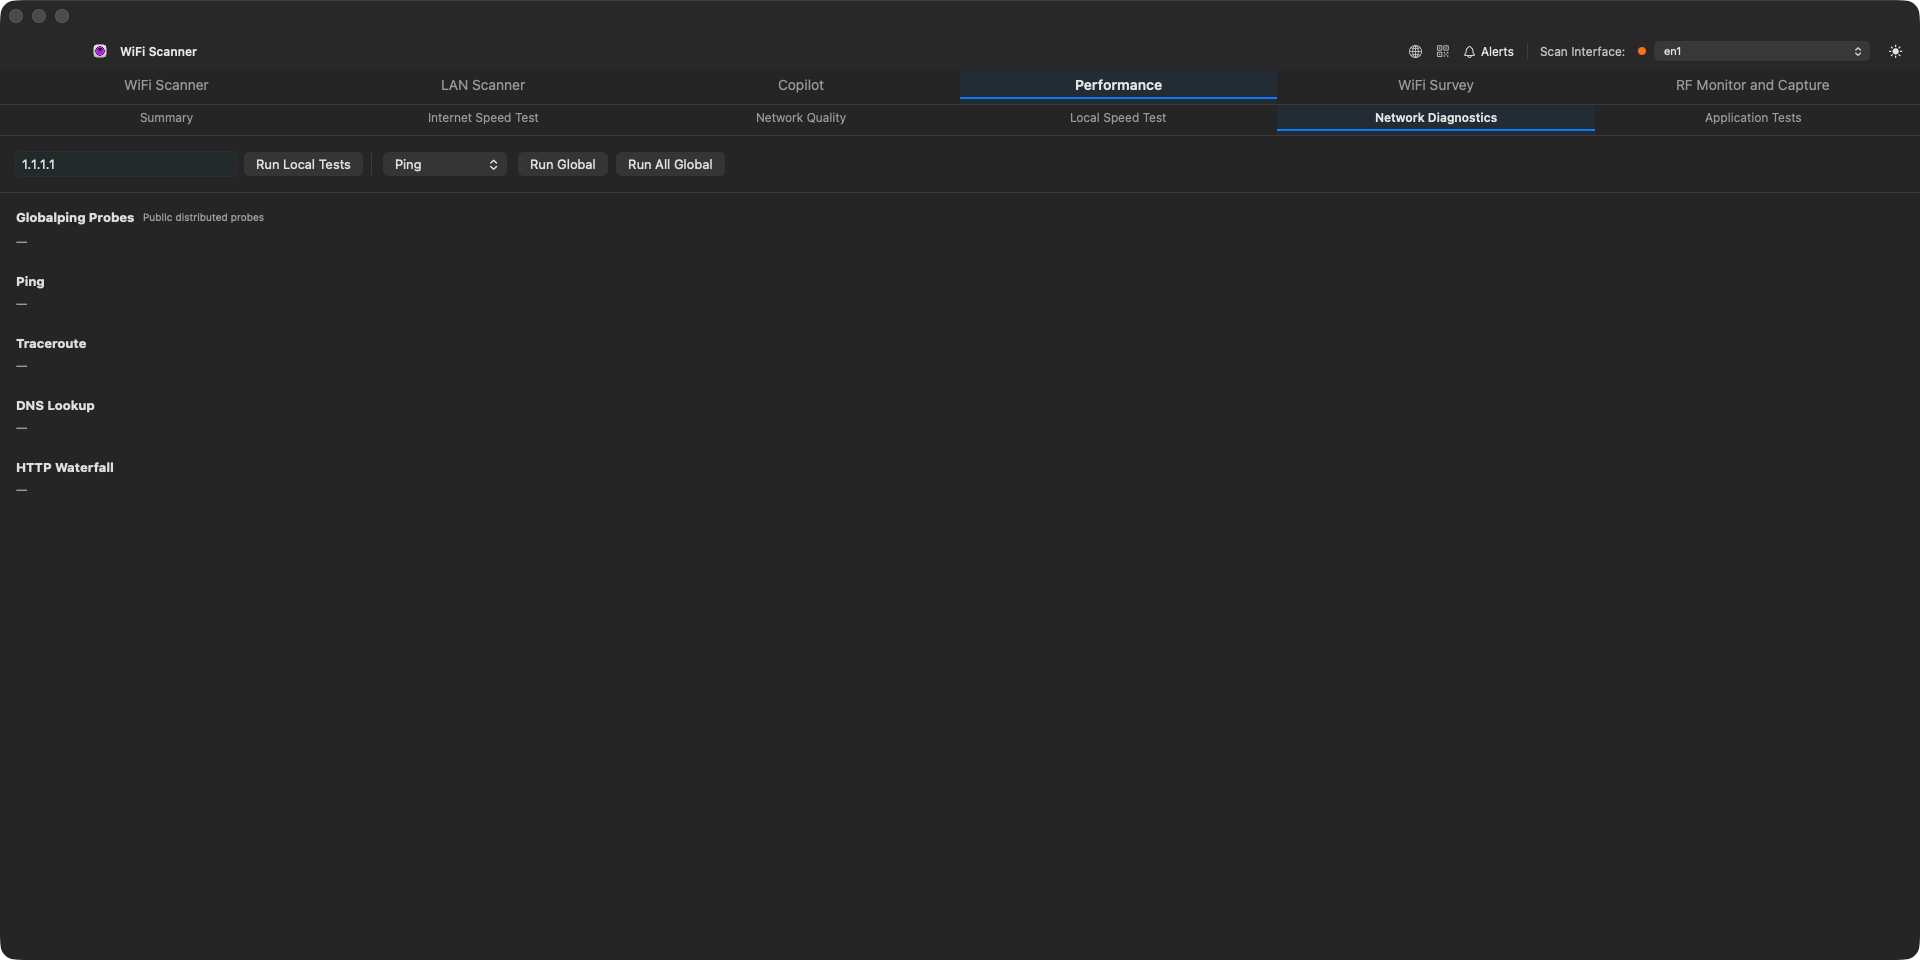
| Network Diagnostics | Lower-level connectivity checks (DNS, gateway, routing). |
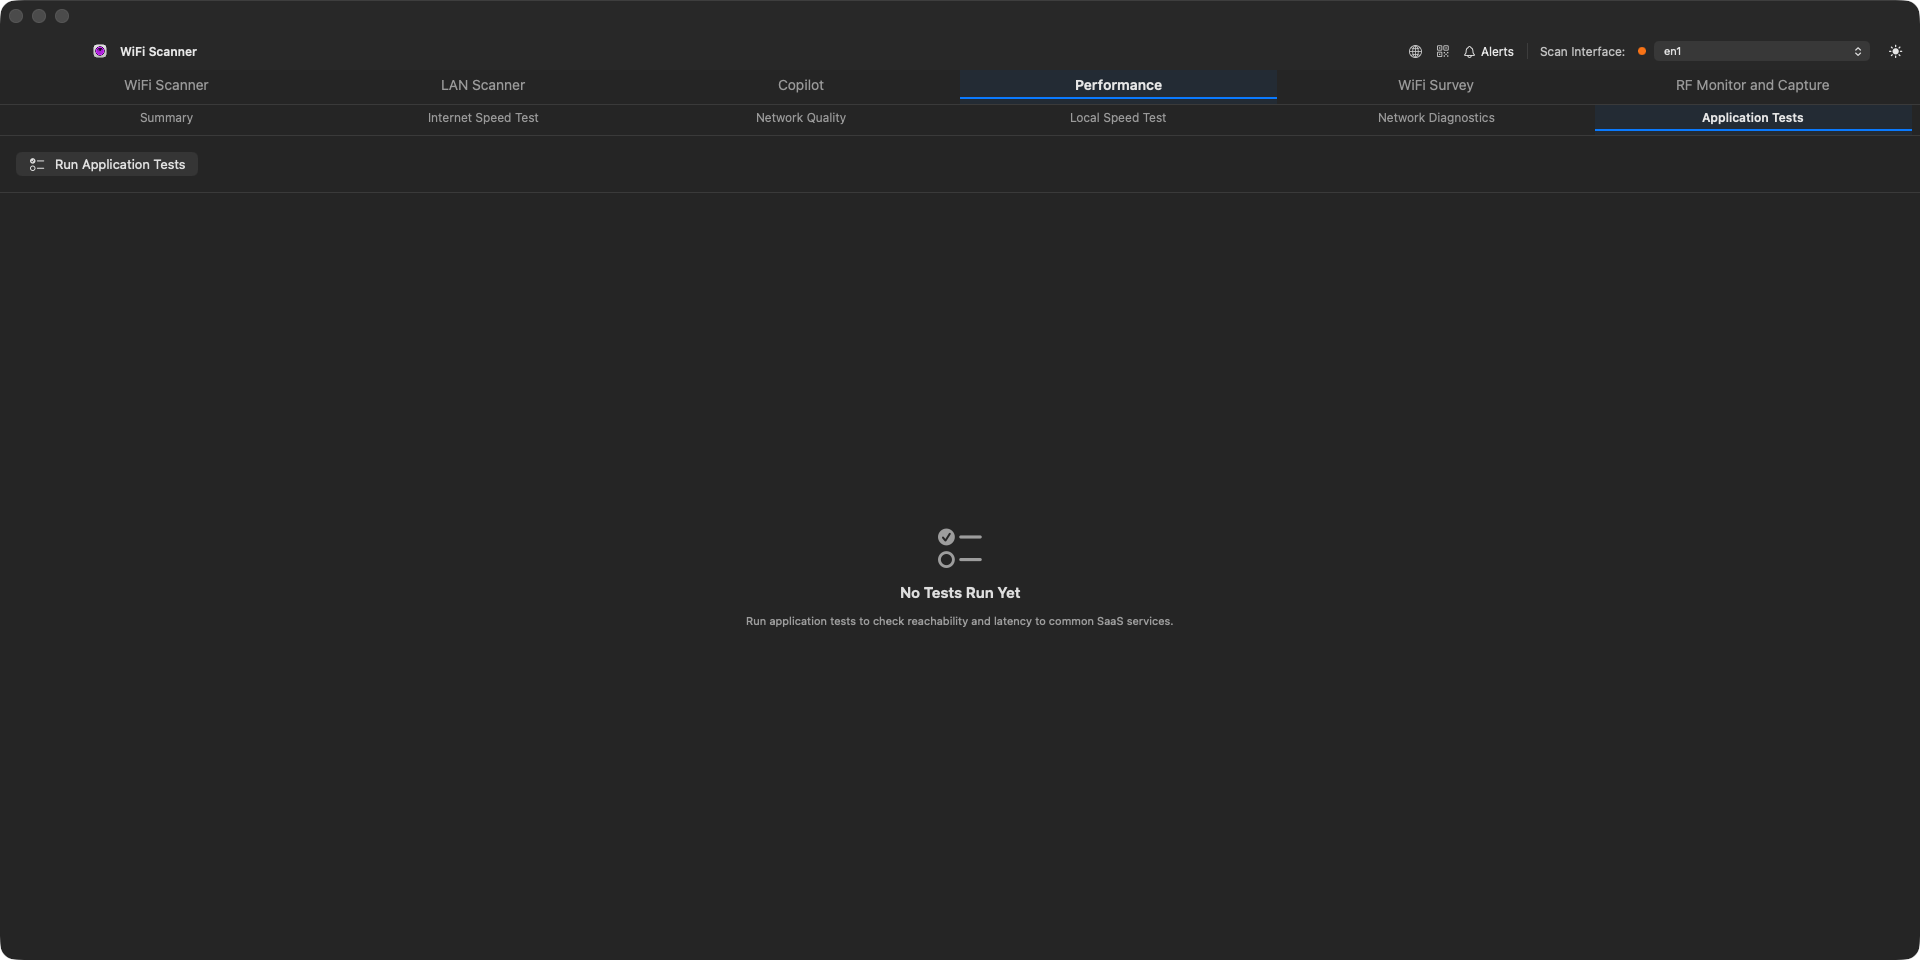
| Application Tests | Reachability/latency checks against common SaaS apps (Zoom, M365, etc.) so you can tell whether it's WiFi or the app's own service having issues. |
WiFi Survey tab
WiFi Survey opens with a sample project loaded so there's always something on screen to explore. Use Open or New to work on your own. It has three numbered modes, walked through via the stepper at the top, each with its own left-side tool rail:
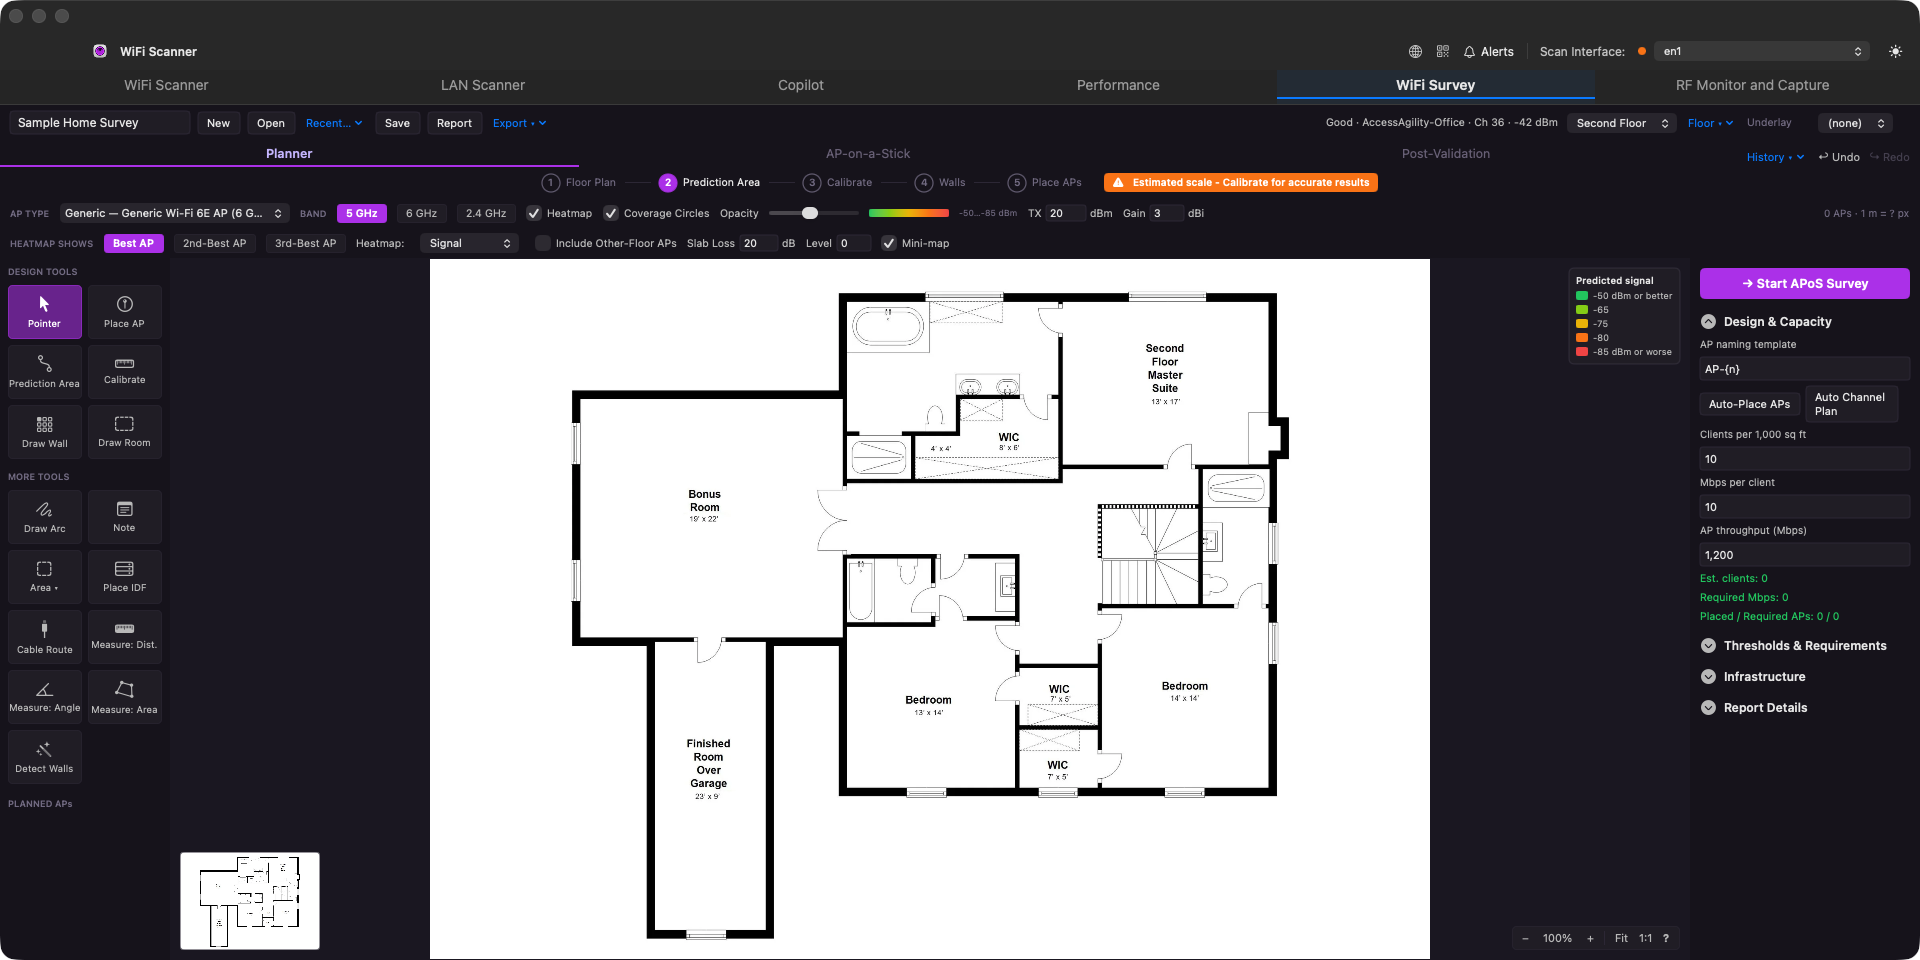
Planner: import or draw a floor plan, place APs (or let Auto-Place APs and Auto Channel Plan do it), and preview coverage with the heatmap before anything is physically installed.
Drawing walls: Draw Wall is a continuous run: click each corner and the wall keeps going, staying joined as you follow the plan around. Right-click or Esc ends the run, and the next click starts a fresh one. The wall material picked in the toolbar applies to each segment as it is drawn, so you can change material partway round.
Prediction Area: its dashed outline and corner flags appear only while the Prediction Area tool is selected. They are editing handles rather than part of the plan, so they stay out of the way while you place APs or read the heatmap; reselect the tool to move them again.
AP-on-a-Stick
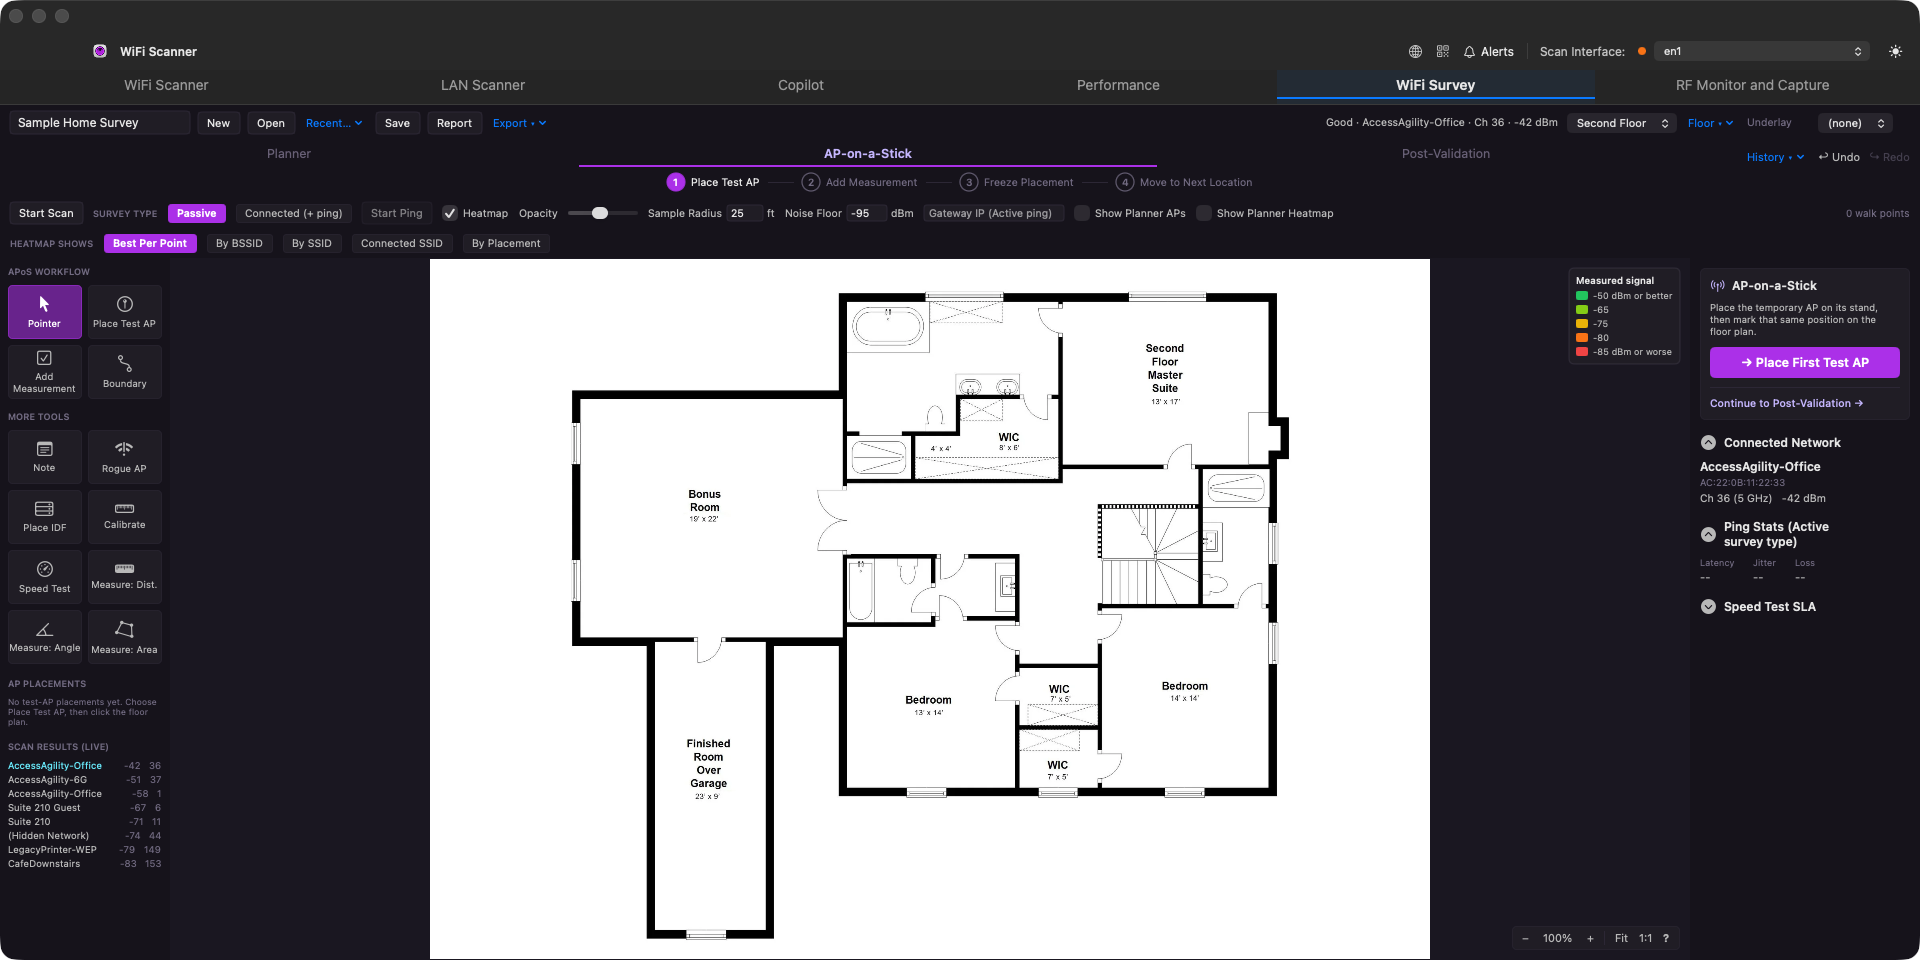
Walk the actual space with a temporary AP and your Mac, recording real signal readings to validate the plan against reality. The numbered stepper (Place Test AP → Add Measurement → Freeze Placement → Move to Next Location) keeps you on track, and the right-side panel shows live ping stats and ties each walk point back to the network you're actually connected to.
What a measurement click does: a passive measurement takes a fresh scan at that exact spot rather than reusing the last scan tick, which takes a few seconds. A ring appears on the point straight away and fills as the scan runs, so you can see the click registered and how much of the wait is left; the marker replaces it when the reading lands. Clicking again while the ring is still filling does nothing; wait for it to finish. Passive capture needs scanning switched on: if it is not, the app says so rather than recording a stale reading.
Freezing a placement ends that walk. The next measurement starts a new path, so each placement's readings stay separate instead of being joined into one line across the floor.
Reading a point back: with the Pointer tool, click any walk point to open every network that was heard there: SSID, BSSID, channel and signal, strongest first, with that point's own strongest reading highlighted. This is the whole passive snapshot, not just the headline network, so you can answer "how strong was the other SSID right here?" long after the walk. Active points record only the connected network, so they show that one instead of a list.
Post-Validation
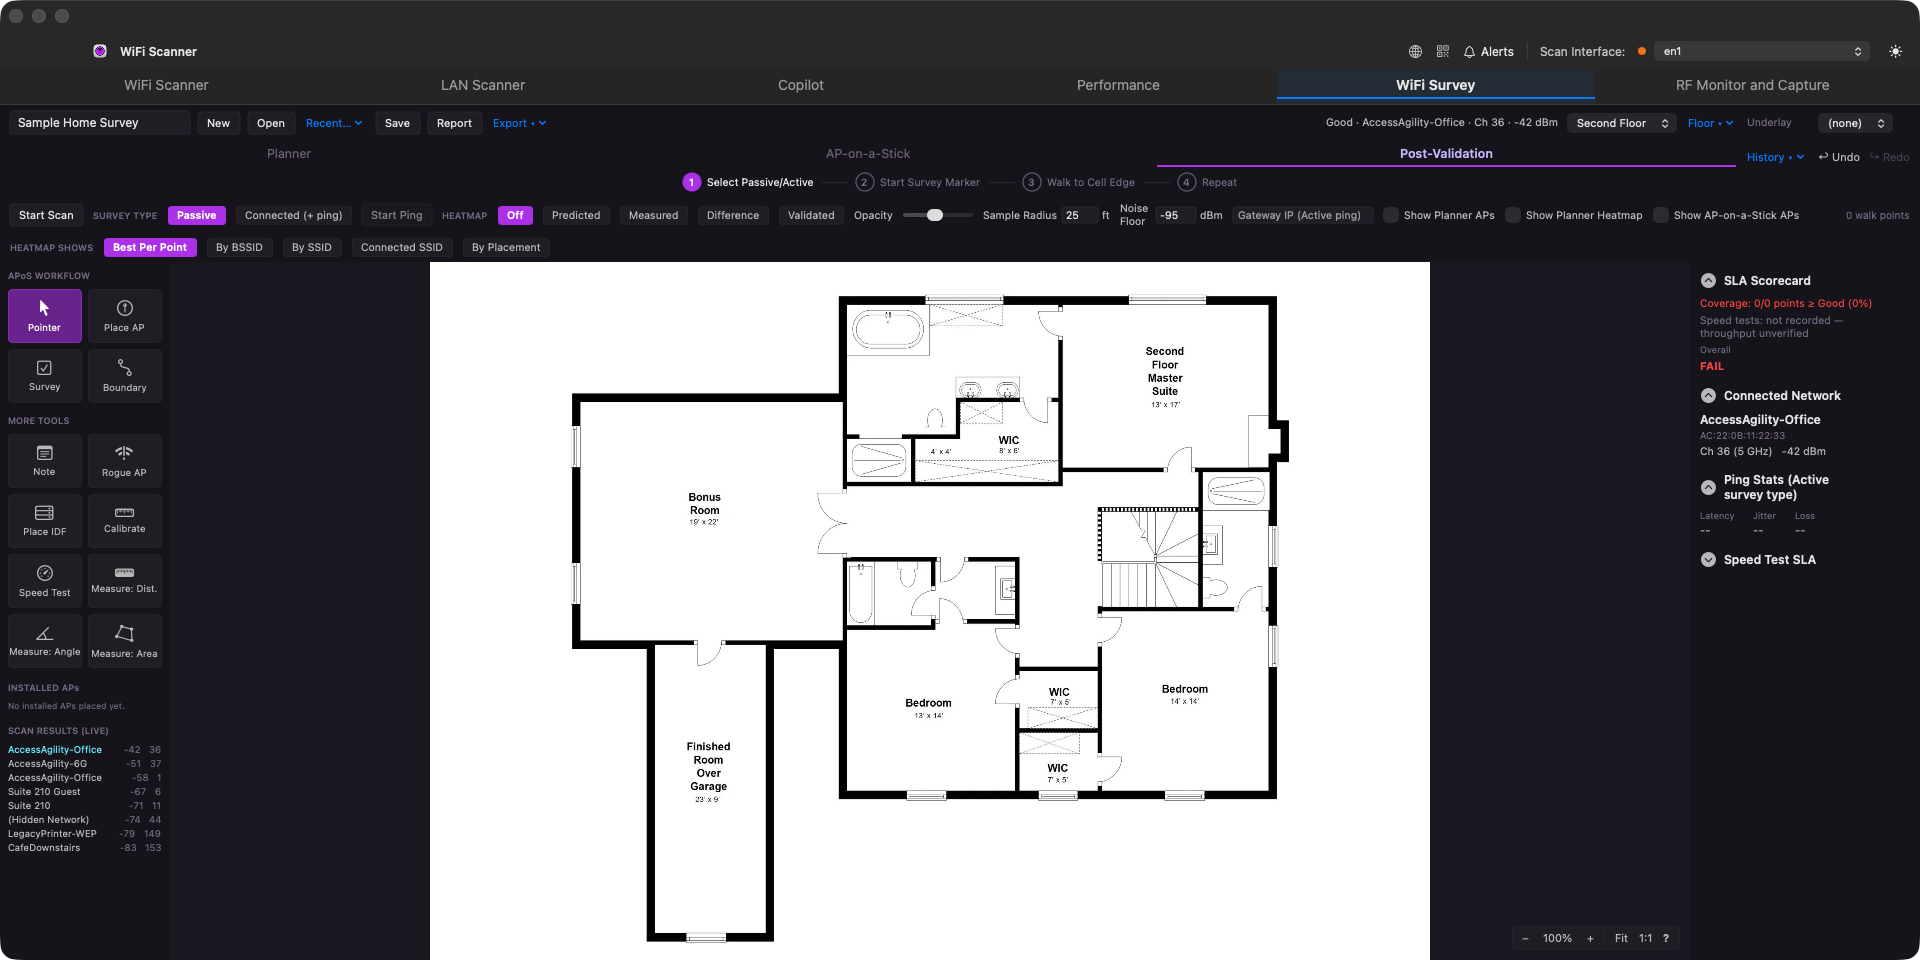
After APs are permanently installed, walk the space again to confirm real-world coverage matches what was promised. The SLA Scorecard panel gives a straight pass/fail verdict (coverage percentage at or above your target, speed tests where required) rather than making you eyeball a heatmap.
The right rail (Planner mode) holds design controls (AP type, band, heatmap display, capacity thresholds, infrastructure). Export and Report produce PDF/Word deliverables; Share opens multi-user survey collaboration, syncing through the same hosted relay Windows uses. Temporarily unavailable while a sync bug is being fixed, and not included in the trial or the Pro license for this release.
RF Monitor and Capture tab
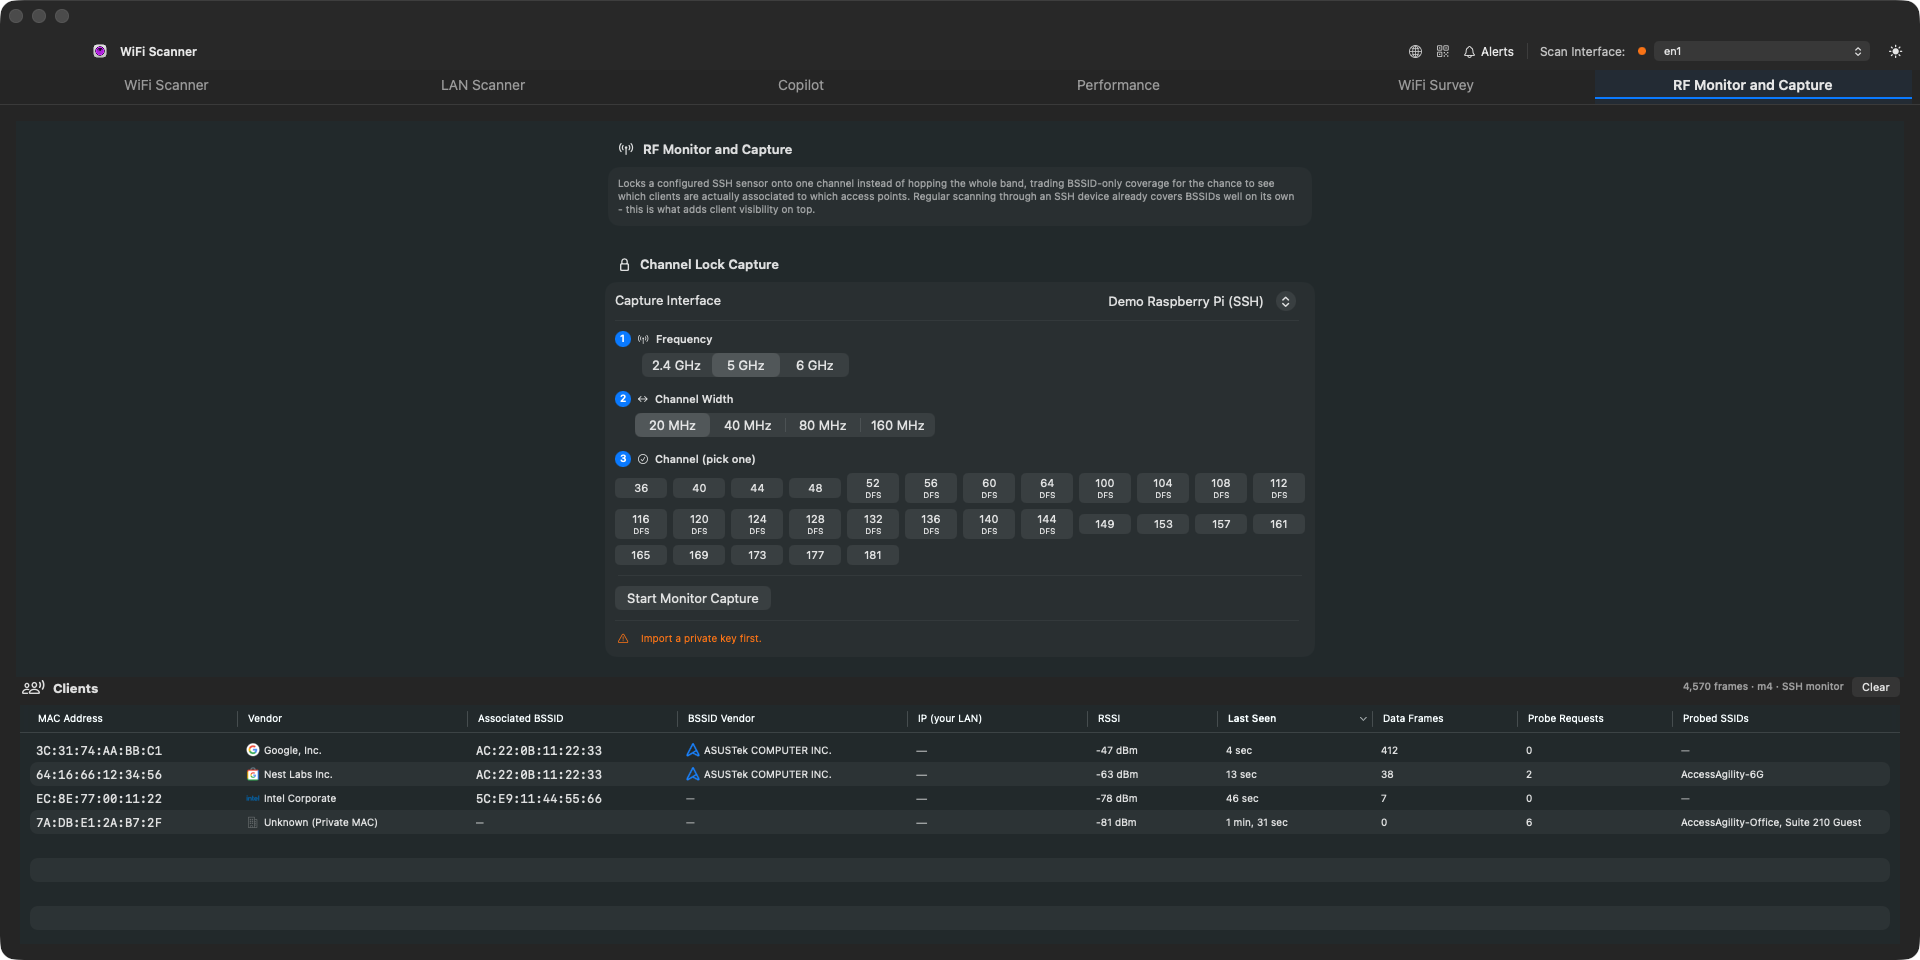
Locks a configured SSH sensor onto one channel instead of hopping the whole band, trading
BSSID-only coverage for the chance to see which clients are actually associated to which access
points. Regular scanning already covers BSSIDs well; this is what adds client visibility on top.
Part of the RF Monitor add-on, and it needs a sensor: a Raspberry Pi or WLAN Pi running
iw, ip and tcpdump with passwordless sudo for those three.
Sensors are configured in Settings → Remote Scanner. This tab only picks among the ones already configured, the same split Windows makes.
Setting up a capture
- Capture Interface: which configured sensor to use.
- Frequency: 2.4, 5 or 6 GHz. Bands the adapter does not report are hidden entirely, so a card with no 6 GHz radio does not offer 6 GHz.
- Channel Width: 20/40/80/160 MHz (320 MHz on 6 GHz). Widths the adapter does not advertise are hidden.
- Channel: the grid narrows as the width widens, showing only channels that are legal primaries at that width. DFS marks 5 GHz channels requiring radar detection, PSC marks 6 GHz Preferred Scanning Channels, and REC marks the non-overlapping 2.4 GHz channels (1, 6, 11).
Press Start Monitor Capture. The status line confirms the lock and reports the
width and centre frequency the radio actually applied, for example
Channel lock confirmed (5180 MHz, 80 MHz wide, center 5210 MHz). If a driver quietly
narrows an 80 MHz request to 20 MHz, that is stated rather than hidden.
Clients
Every client seen on the locked channel, with its MAC and vendor, the BSSID it is associated to and that AP's vendor, its IP if it happens to be on your own LAN, RSSI, when it was last heard, and how it was seen (data frames versus probe requests), plus any SSIDs it probed for. Any column header sorts. A client showing Unknown (Private MAC) and no BSSID is normal: modern phones randomise the MAC they probe with, which defeats vendor lookup by design.
Stop Capture offers to save the capture as a pcapng and opens it in Wireshark if it is installed.
Reports
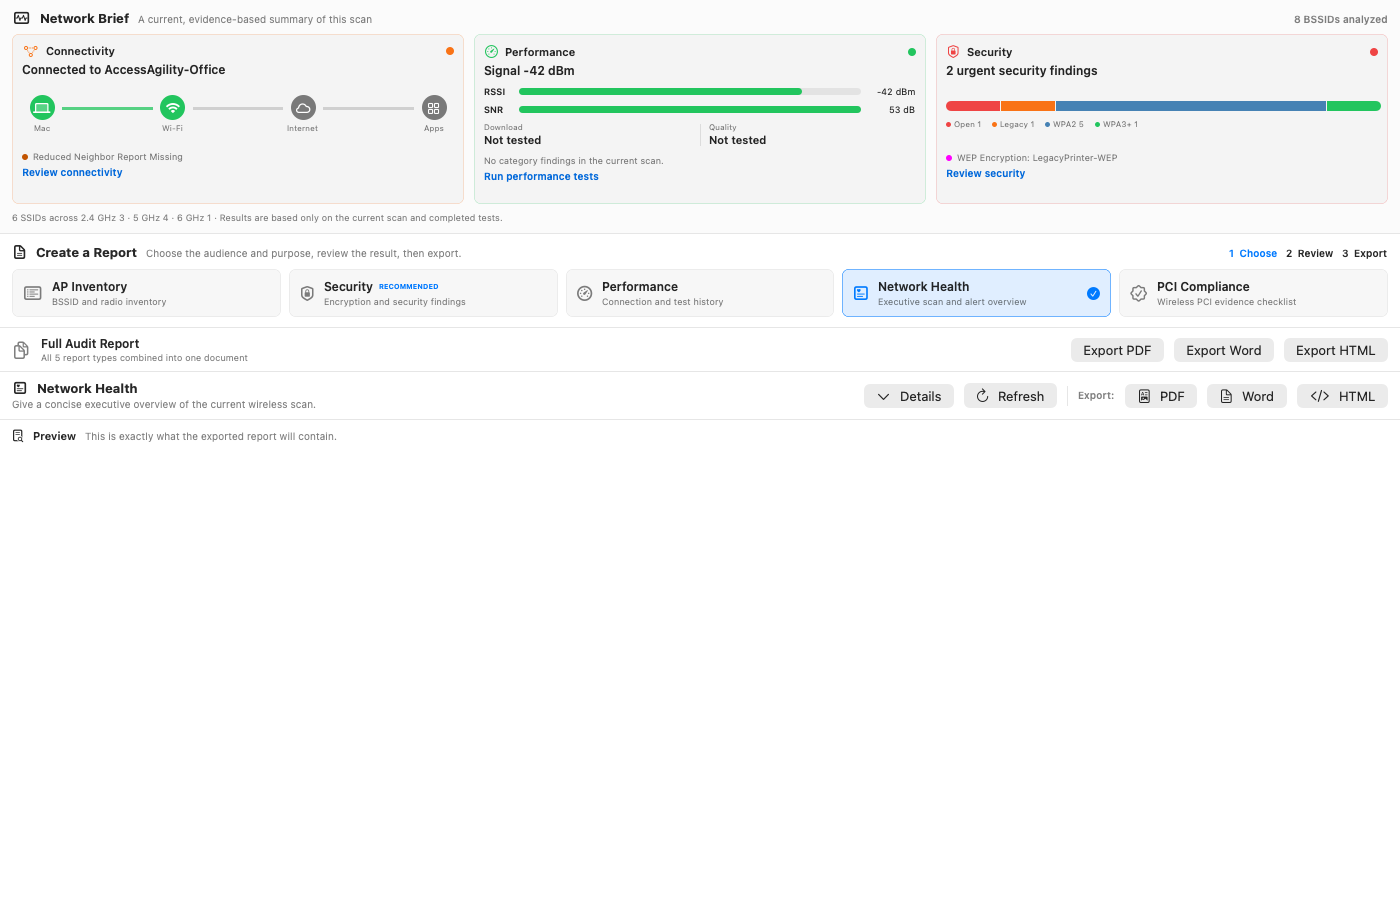
Reached from the Copilot tab's Reports card, or the report-generating AUTO cards elsewhere in Copilot that jump straight here with a specific type pre-selected. The Network Brief at the top is always current: a live Connectivity/Performance/Security summary of the active scan, each with a one-click Review… link into the relevant detail. Below it, pick a report type and export it as a PDF, Word document, or standalone HTML file; Full Audit Report combines all five types into one document.
Settings
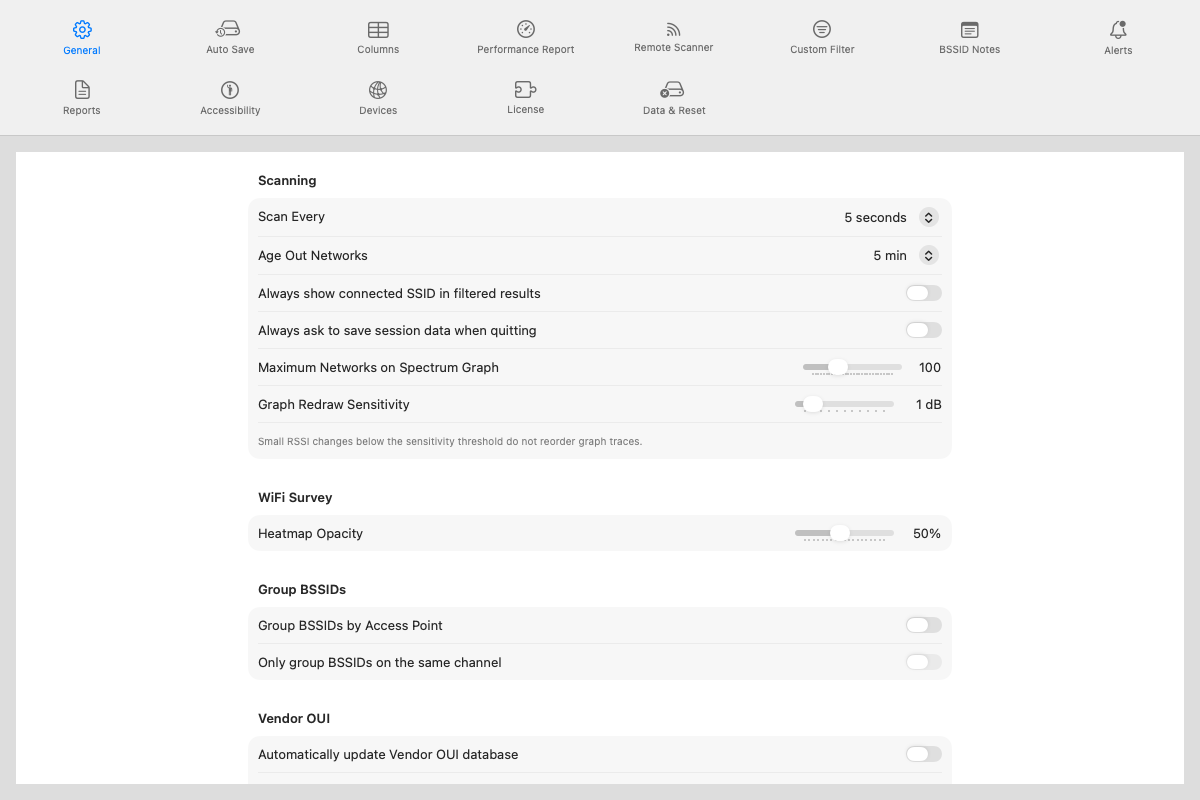
Open Settings with ⌘, or WiFi Scanner → Settings…. It's a flat
icon-grid of panes (not macOS's usual tab strip), styled to match the Windows Settings window.
Remote Scanner
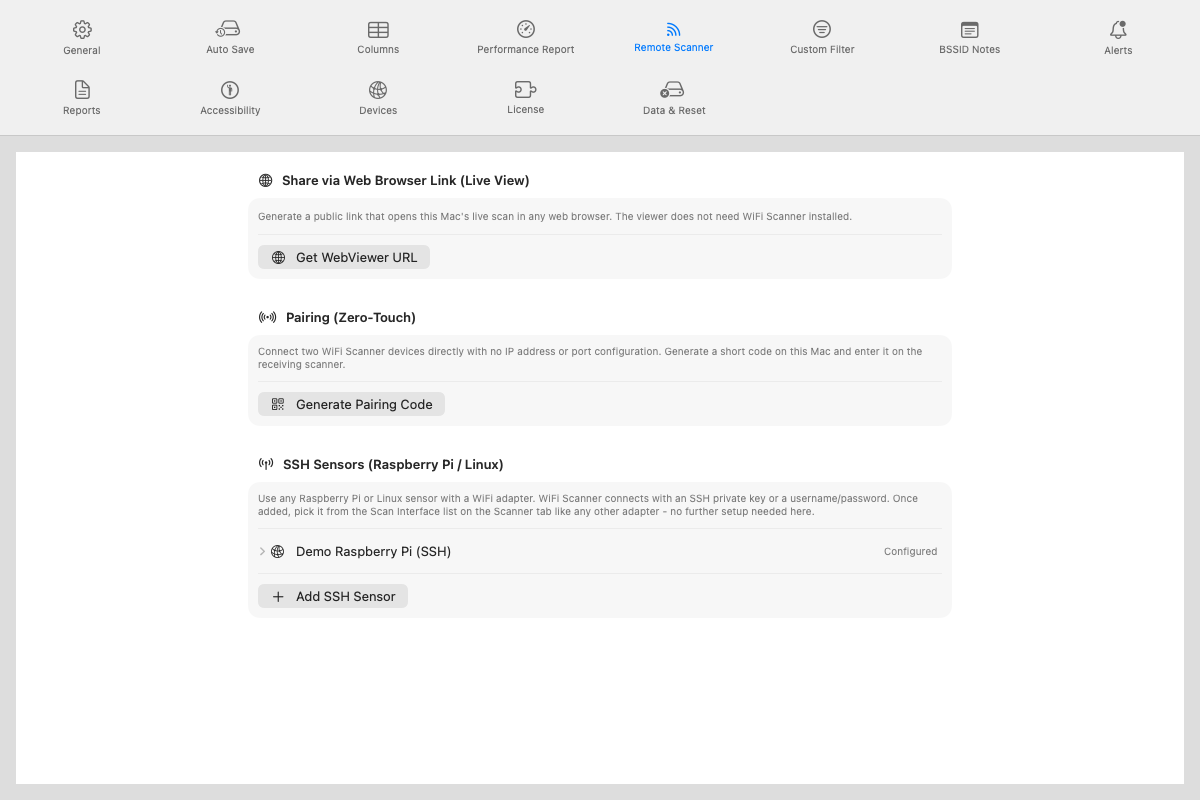
Add, edit, and remove SSH-connected sensor devices (host, port, username, key or password credential). Use any Raspberry Pi or Linux sensor with a monitor-mode-capable WiFi adapter. A device configured here is what powers both the SSH Scan Interface entry on the Scanner tab and RF Monitor's channel-lock capture, which is bundled into a Pro license rather than sold separately.
BSSID Notes
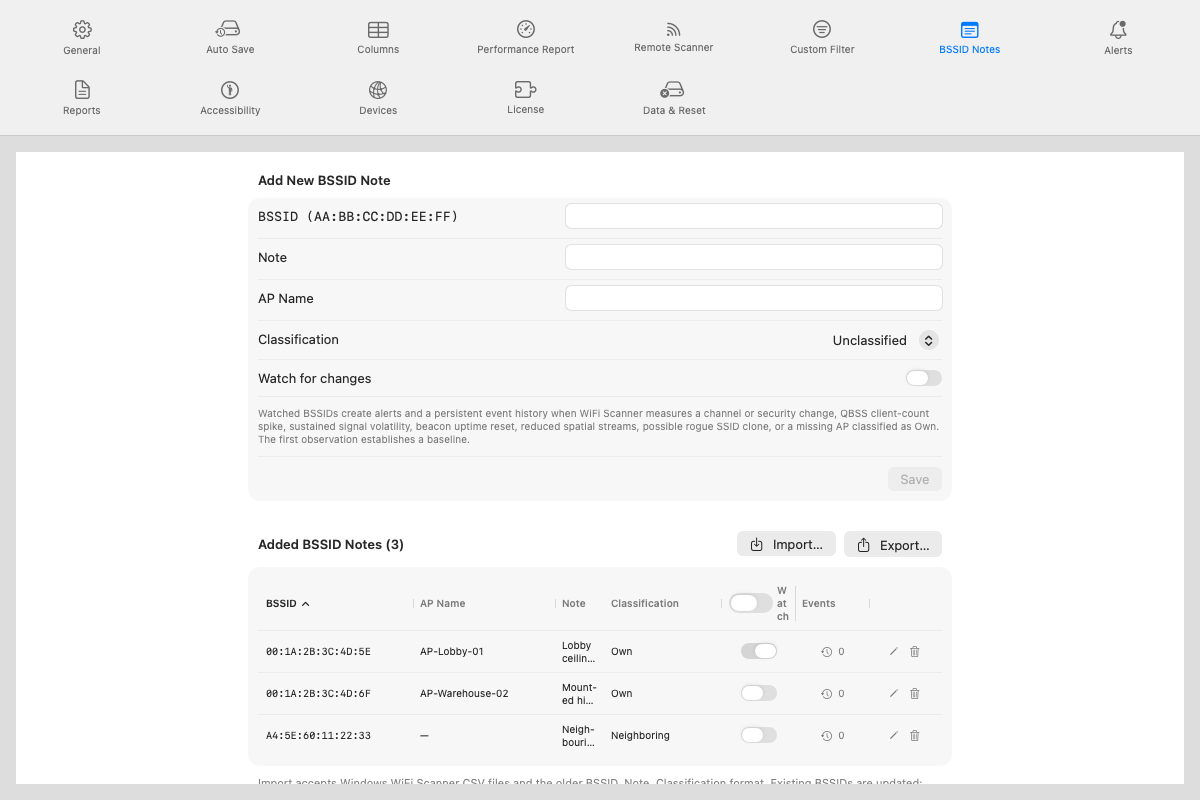
Every classification and note you set here, whether from this pane, the grid's own controls, or the "Is this your network?" prompt, feeds the same store, so alerts, reports, and AP monitoring stay scoped to networks you've actually told WiFiScanner you manage.
Spectrum
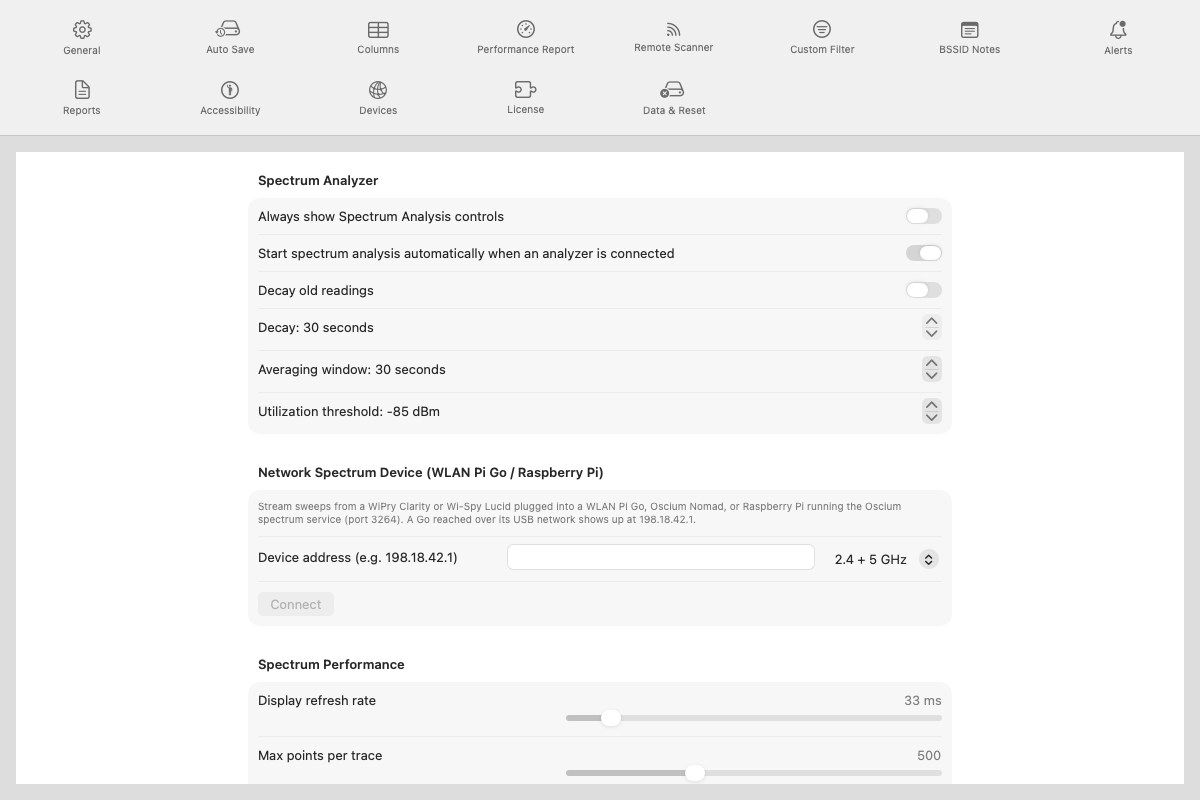
This pane only appears once the Spectrum add-on is enabled. It is part of Enterprise, and is not granted during the trial while spectrum analysis is in beta.
Spectrum Analyzer covers a directly-attached WiPry Clarity or Wi-Spy: whether to keep the analysis controls on screen at all times, whether sweeping starts by itself when an analyzer is plugged in, and how the live trace behaves. Decay is how quickly it falls after a signal disappears (which is what separates a microwave or a Bluetooth burst from a permanent occupant), Averaging window smooths the trace over time, and Utilization threshold is the power level above which a frequency counts as occupied for channel-utilization math.
Network Spectrum Device takes sweeps from an analyzer plugged into a WLAN Pi Go,
Oscium Nomad, or Raspberry Pi running the Oscium spectrum service on port 3264, rather than into this
Mac. Enter the device's address and the band to sweep, then Connect. A WLAN Pi Go
reached over its own USB network answers at 198.18.42.1.
Spectrum Performance is four sliders to trade detail for speed if the spectrum views feel sluggish: display refresh rate, max points per trace, waterfall history depth, and density resolution. Density resolution is the biggest lever by far: its cost scales roughly with the square of the percentage.
Integration
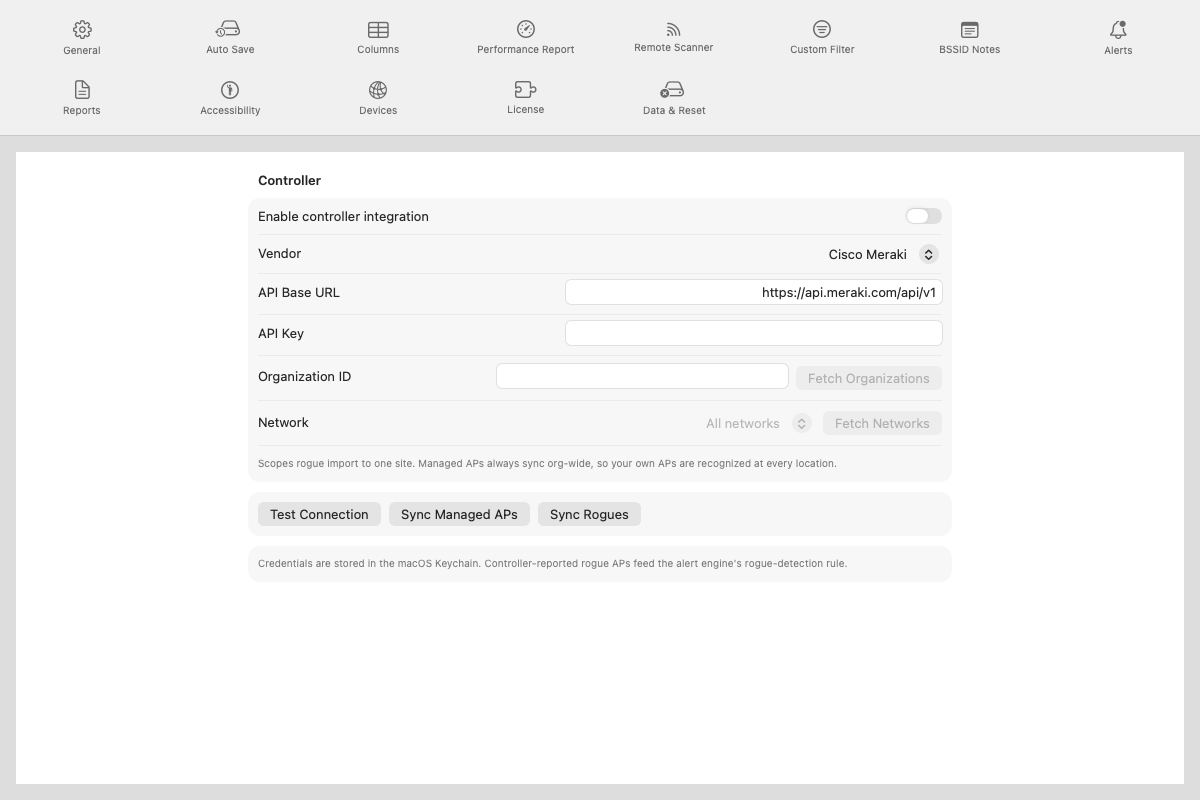
Requires an Enterprise license - not included in Pro, and not granted during the trial. The Integration pane itself is hidden in Settings unless your license qualifies.
Credentials are stored in the macOS Keychain, never in plain preferences. Sync Managed APs pulls your controller's real AP inventory in for comparison against what the scanner actually sees over the air; Sync Rogues feeds controller-reported rogue APs straight into the alert engine's rogue-detection rule.
Accessibility
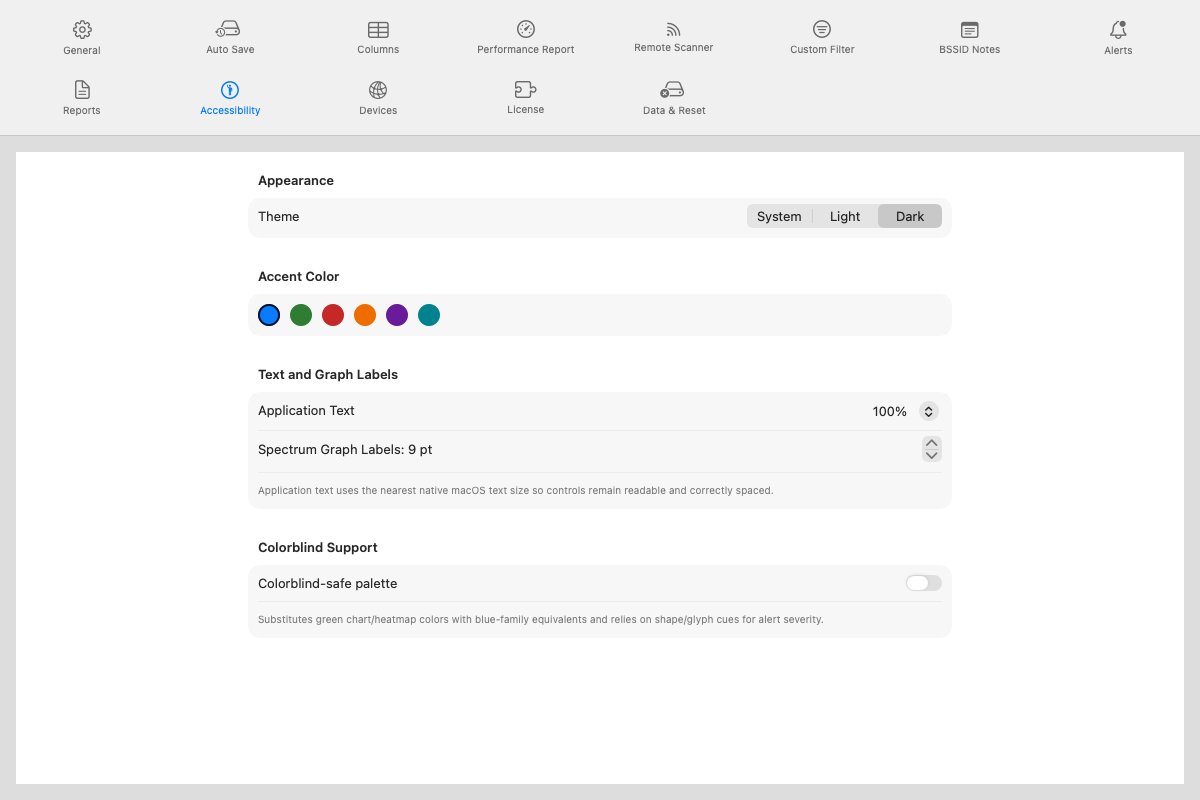
The colorblind-safe palette substitutes blue-family colors for the usual green in charts and heatmaps, and leans on shape/glyph cues rather than color alone for alert severity.
Alerts
License
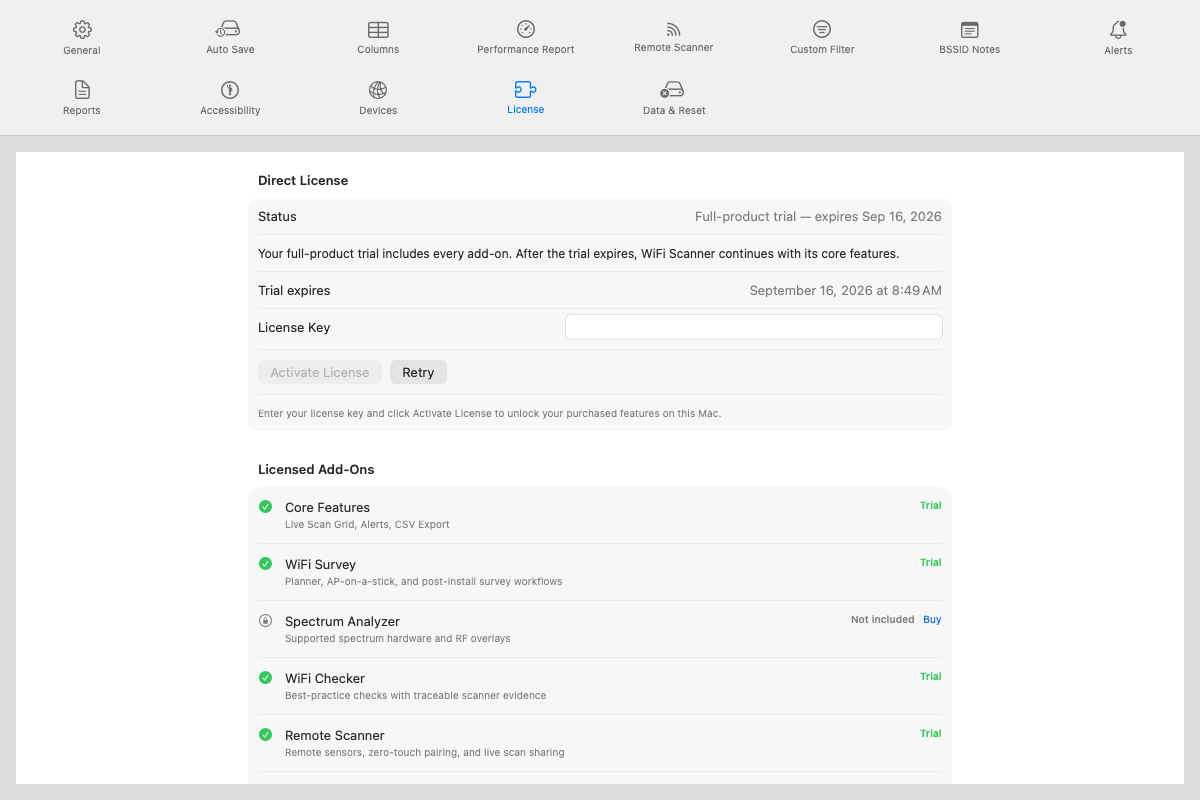
The direct-download build activates against the same license backend as Windows. Paste a license key and it's active. Refresh re-checks your license without re-entering the key (use it right after renewing or adding an add-on); Deactivate… frees this Mac's license slot so you can activate elsewhere.
Below the license block, every add-on shows its own status: Active or Not included (with a Buy link). Core Features (live scan grid, alerts, CSV export) is never gated. It works with no license at all. RF Monitor is bundled into a Pro license rather than sold as its own add-on.
Auto Save
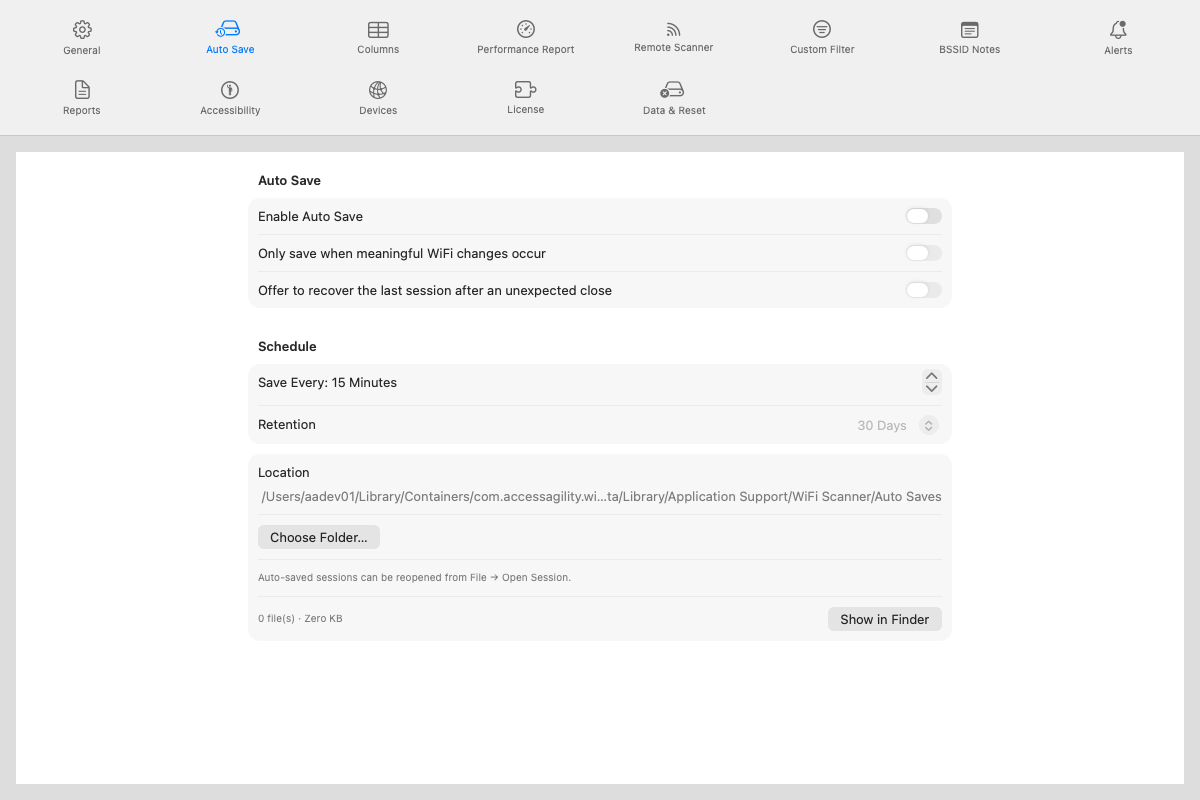
Enable Auto Save saves your session automatically on a timer (default every few minutes, adjustable), with options to only save when something meaningfully changed and to offer recovery after an unexpected close. Choose Folder… picks where auto-saved sessions go; Retention controls how long old auto-saves are kept (1 day, 7 days, 30 days, or Unlimited). Auto-saved sessions reopen from File → Open Session.
Columns
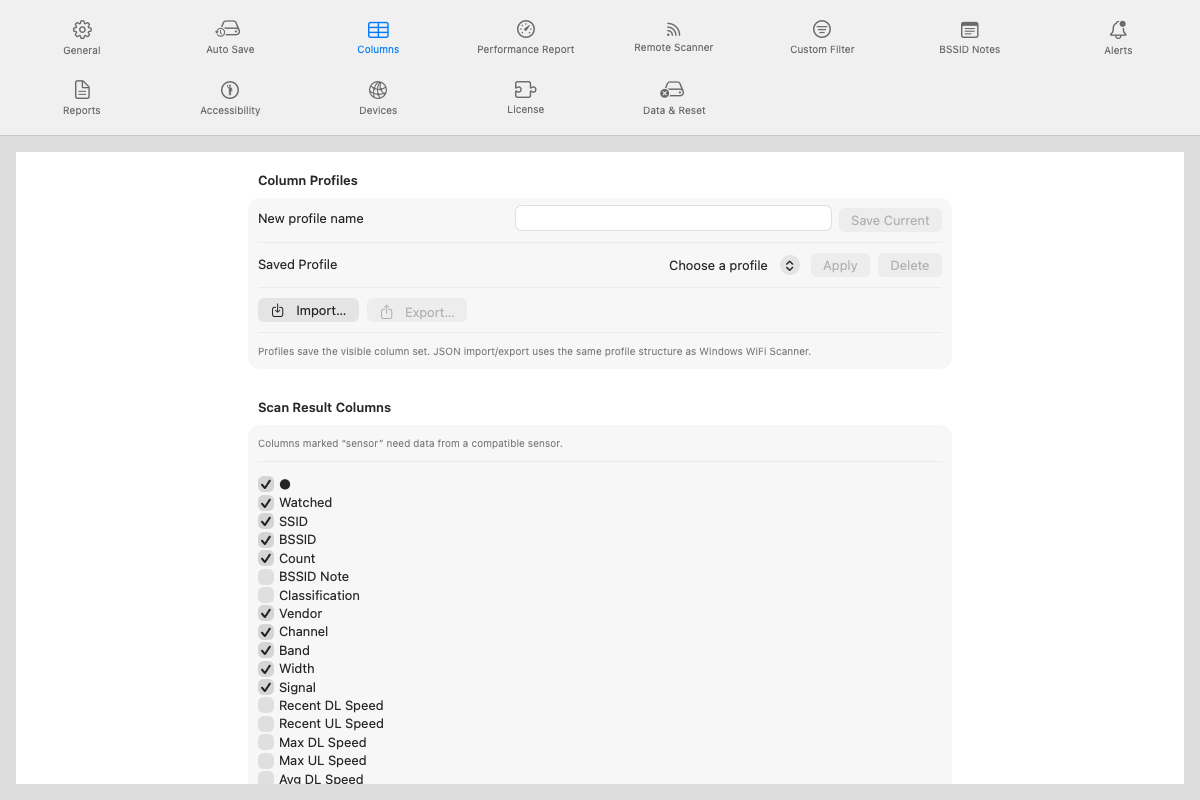
Toggle which of the scan grid's columns are visible. Column Profiles save and restore a named set of visible columns: Save Current, then Apply or Delete a saved profile, or Import… / Export… a profile as JSON. Columns marked "sensor" need data from a compatible SSH sensor.
Custom Filter
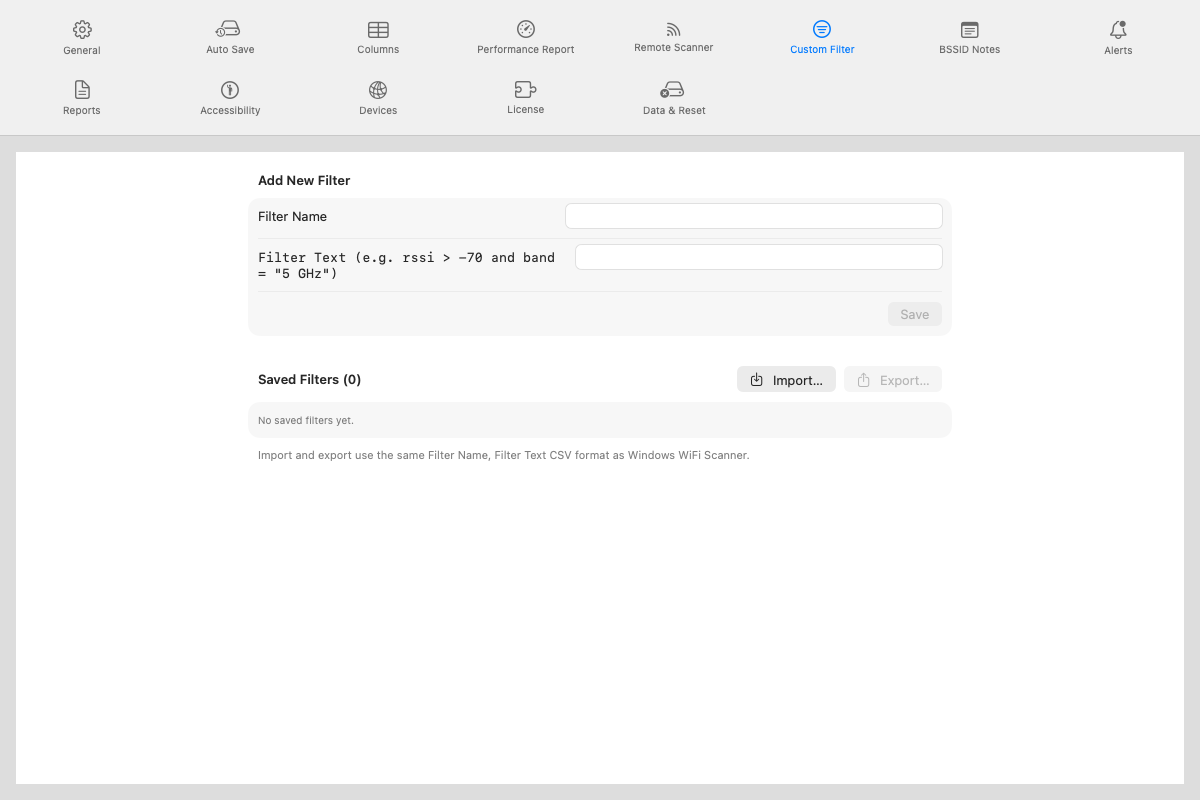
Save named filter expressions (e.g. rssi > -70 and band = "5 GHz") for reuse. Add a
name and filter text, then Save; existing filters can be edited, duplicated, or
deleted. Import… / Export… use CSV.
Performance Report
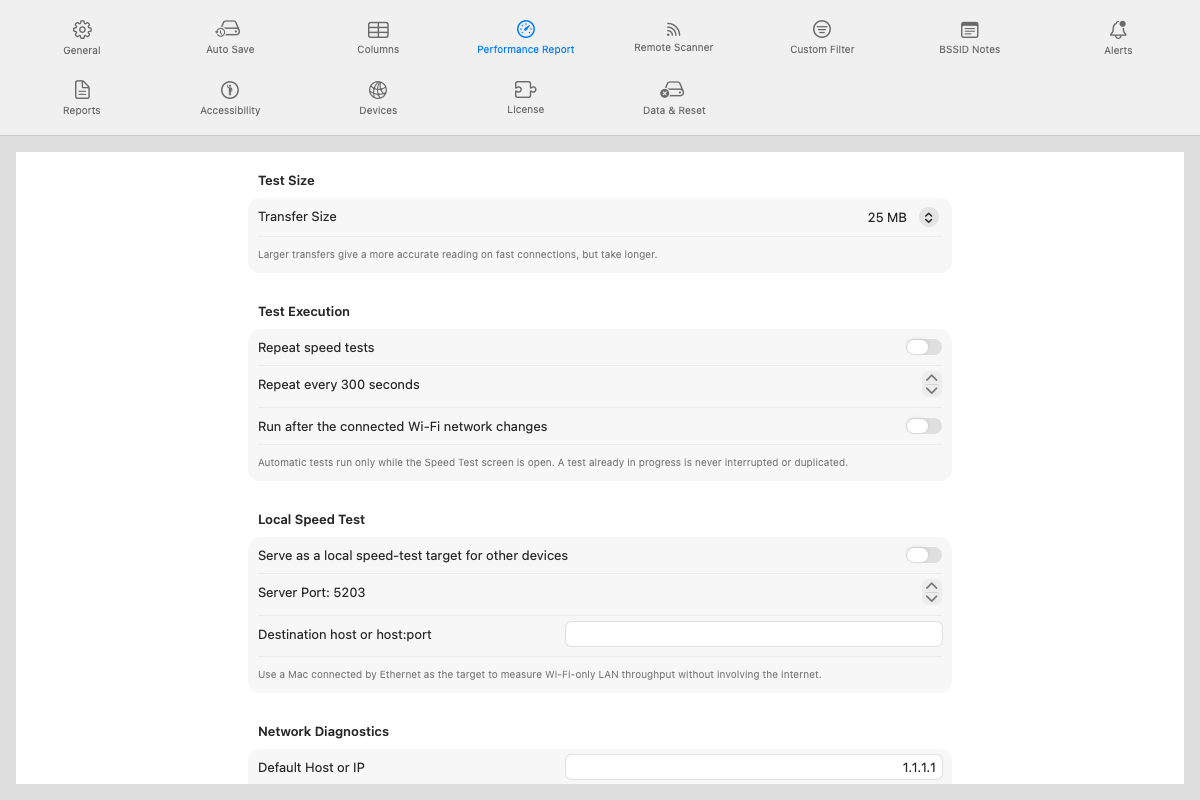
Speed test and diagnostics settings: Transfer Size for the internet speed test (larger is more accurate but slower), automatic repeat testing on an interval or whenever the connected network changes, a Local Speed Test server toggle (serve as a throughput target for other devices on your LAN), a default host for Network Diagnostics, and the editable list of endpoints Application Tests checks (add, edit, delete, or Restore Defaults).
Switch the target on and the pane shows the Server Port and every address this Mac
is listening on, in address:port form and selectable so it can be copied straight into
the other device. Every address is listed rather than one: a Mac routinely has Wi-Fi and Ethernet up
at the same time, plus perhaps a VPN, and only the one on the same network as the other device will
answer. Serving as a target works without a licence, so a spare Mac can be left
running as a speed-test target whether or not its trial has ended.
Reports
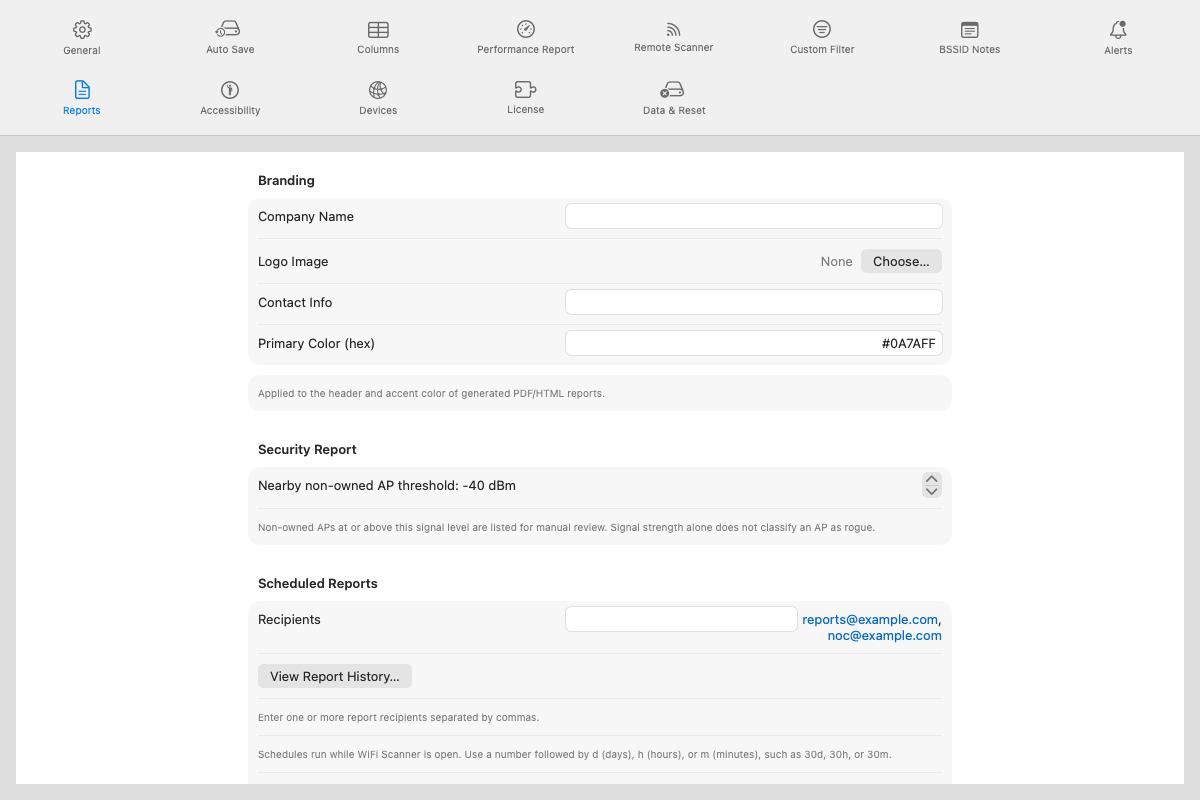
Report Branding (Company Name, Logo, Contact Info, Primary Color) applies to every generated report. Below it: a strong-signal threshold for the Security report's nearby-AP review, Scheduled Reports (recipients and a per-report-type schedule (interval, PDF/CSV attachment, and a Send Now button), plus a Report History log), and PCI DSS report scope (CDE subnets and SSIDs, a strong-signal review threshold, and the same eight self-attestation questions as Windows).
Devices
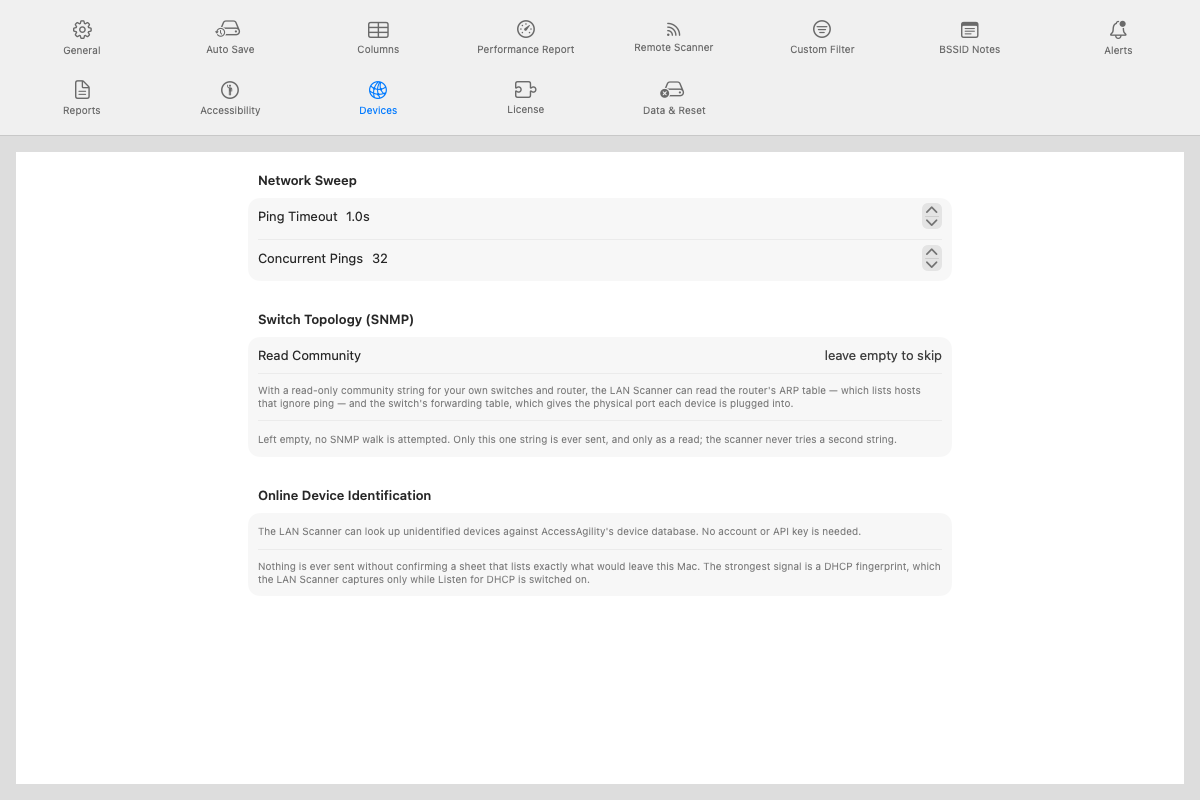
Two settings for the LAN Scanner tab's network sweep: Ping Timeout and Concurrent Pings, for tuning how the LAN device scan trades speed against reliability on slower or more congested networks.
Data & Reset
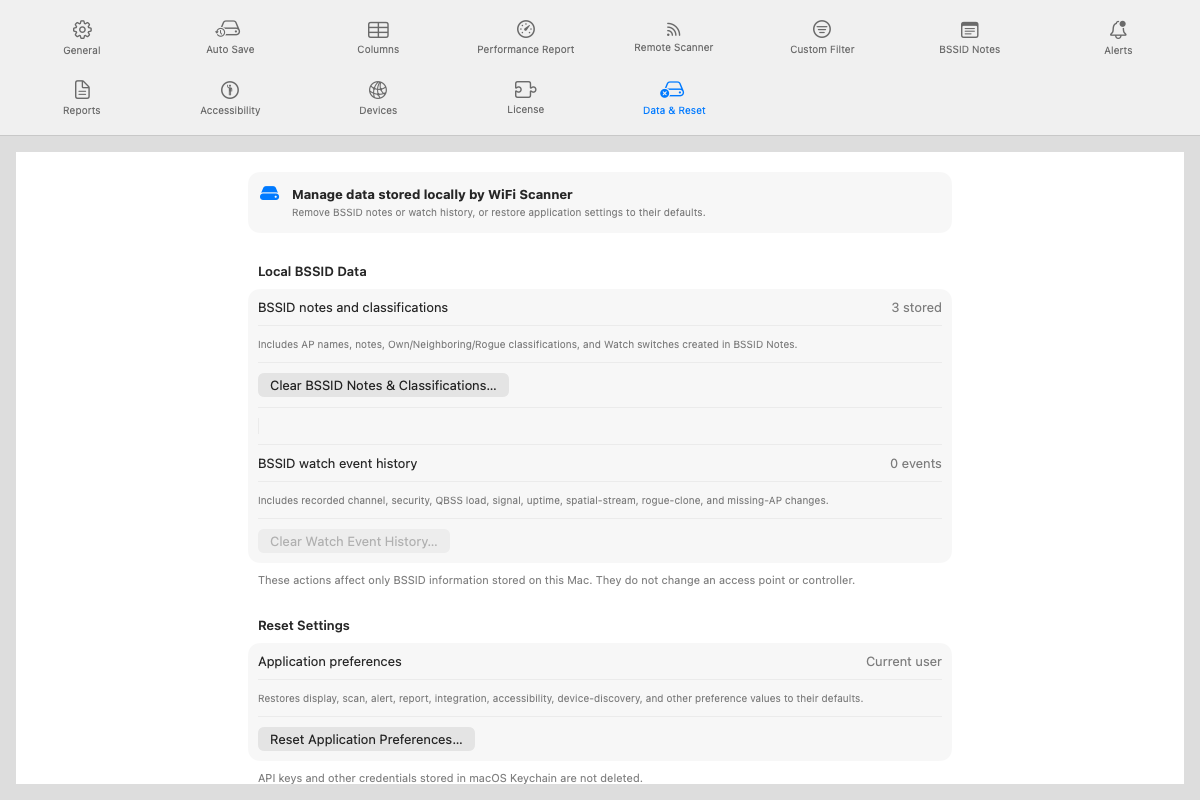
Local data management, kept separate so one type of data can be cleared without affecting another: Clear BSSID Notes & Classifications… removes AP names, notes, and Own/Neighboring/ Rogue classifications; Clear Watch Event History… removes recorded change events without touching notes or classifications; Reset Application Preferences… restores every setting to its default. Every action asks for confirmation first. API keys and other credentials stored in macOS Keychain are never affected by any of these.
Prompts you'll see
"Location Access Needed"
Shown on the Scanner tab until Location permission is granted. See Scanner tab above. If macOS never shows the system dialog (common right after a fresh install), the app falls back to opening System Settings → Privacy → Location Services after a couple of seconds so you can enable it manually.
"Is this your network?"
The first time you connect to a network WiFiScanner hasn't seen classified before, it asks once: Yes, This Is Mine classifies it Own, No, Not Mine classifies it Neighboring. This is the same classification shown and editable later in Settings → BSSID Notes.
"Recover Session?"
If WiFiScanner didn't close cleanly last time, this offers to reopen the most recent auto-saved session rather than silently losing it.
Where this differs from Windows
The two apps are built to the same design and cover the same workflows, but a few differences are real and worth knowing rather than discovering by surprise:
- RF Monitor (channel-lock packet capture) only works against an external SSH sensor. Same as Windows, this Mac's own WiFi radio can't do local monitor-mode capture either.
- Raw 802.11 Information Elements: both apps now decode the same elements to the same depth. What remains is the source, not the decoder: macOS's public WiFi APIs hand over fewer of an AP's raw elements for a locally scanned network than Windows can read directly, so a capture or an SSH sensor shows more than the Mac's own radio does.
- Survey Collaboration now syncs through the same hosted relay Windows uses, not peer-to-peer, so it is no longer a platform difference. It's temporarily unavailable on both platforms this release while a sync bug is being fixed.
- Controller integrations (Meraki, Catalyst, Aruba, Mist, UniFi) match Windows' own coverage: both platforms implement the same subset of the full vendor catalog, and both require an Enterprise license (not Pro, not the trial).